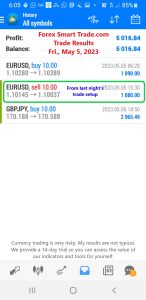
Forex Smart Trade Results, Friday, May 5, 2023 – $5,016

Forex Smart Trade Results, Thursday, May 4, 2023 – $17,835
May 20, 2023
Forex Smart Trade Results, Monday, May 8, 2023 – $5,284
May 21, 2023Moving Average Ribbon Example.
Continuing our discussion, let’s take a look at a moving average ribbon example.
Let’s take a look at a moving average ribbon applied to GBP/USD on a 1-hour chart.
Can you see the trend changes?
In the chart above, you can easily identify bullish or bearish trends by looking at when the moving averages start to cross over or “twist” lower or higher.
Ribbon expansion or the widening of spacing between the moving averages suggests the end of the current trend.
Ribbon contraction or the narrowing of spacing between the moving averages suggests the start of a new trend.

Learn to Currency Trade
If you’d like to earn extra income trading on the Forex market, consider learning how to currency trade with Forex Smart Trade. With their super-accurate proprietary trading tools and best-in-the-business, personalized one-on-one training, you’ll be successful. Check out the Forex Smart Trade webinar. It shows one of their trader’s trading and how easy, intuitive, and accurate the tools are. Or try the Forex Smart Trade 14-day introductory trial for just TEN dollars.


