Forex Smart Trade Results, Monday, September 4, 2023 – $2,229

Forex Smart Trade Results, Friday, September 1, 2023 – $10,853
September 4, 2023
Forex Smart Trade Results, Tuesday, September 5, 2023 – $8,404
September 9, 2023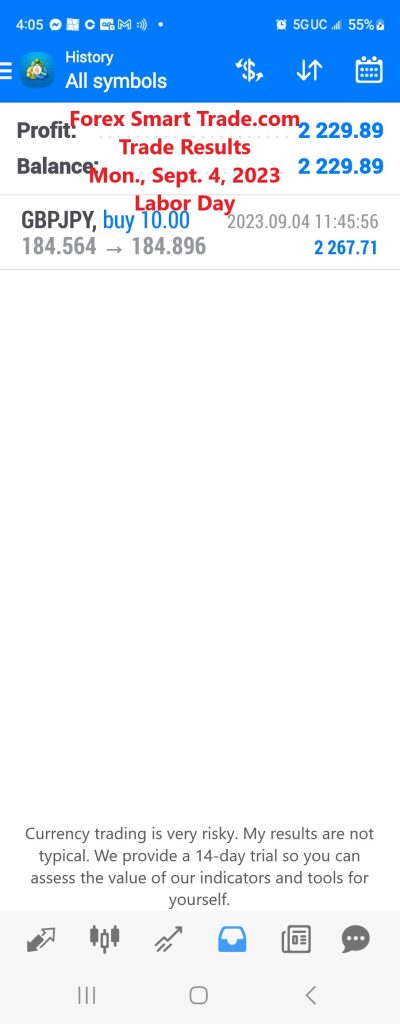
Camarilla Pivot Point.
Let’s take a look at a Camarilla pivot point.
R4 = C + ((H-L) x 1.5000)
R3 = C + ((H-L) x 1.2500)
R2 = C + ((H-L) x 1.1666)
R1 = C + ((H-L) x 1.0833)
PP = (H + L + C) / 3
S1 = C – ((H-L) x 1.0833)
S2 = C – ((H-L) x 1.1666)
S3 = C – ((H-L) x 1.2500)
S4 = C – ((H-L) x 1.5000)
C – Closing Price, H – High, L – Low
The Camarilla formulas are similar to the Woodie formula. They also use the previous day’s close and range to calculate the support and resistance levels.
The only difference is that you should calculate for 8 major levels (4 resistance and 4 support), and each of these levels should be multiplied by a multiplier.
The main concept of Camarilla pivot points is that it is based on the idea that price has a natural tendency to revert back to the mean (sound familiar?).
Or in this case, the previous day’s close.
The idea is that you should buy or sell when the price reaches either the third support or resistance level.
However, if the price were to burst through S4 or R4, it would mean that the intraday trend is strong.
And it’s about time you jump on that bandwagon!
Check out how the Camarilla calculation gives different levels (solid lines) compared to the standard method’s levels (dotted lines)!

As you can see from the chart above, they gave more emphasis to the closing price as opposed to the pivot point.
Because of this, it’s possible that resistance levels could be below the pivot point or support levels could be above it.
See how all the support and resistance levels are above the Camarilla pivot point?
Learn to Day Trade Forex
If you’d like to earn extra income trading on the Forex market, consider learning how to currency trade with Forex Smart Trade. With their super-accurate proprietary trading tools and best-in-the-business, personalized one-on-one training, you’ll be successful. Check out the Forex Smart Trade webinar. It shows one of their trader’s trading and how easy, intuitive, and accurate the tools are. Or try the Forex Smart Trade 14-day introductory trial for just TEN dollars.