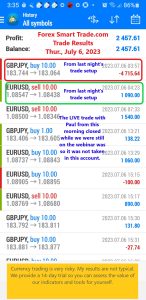
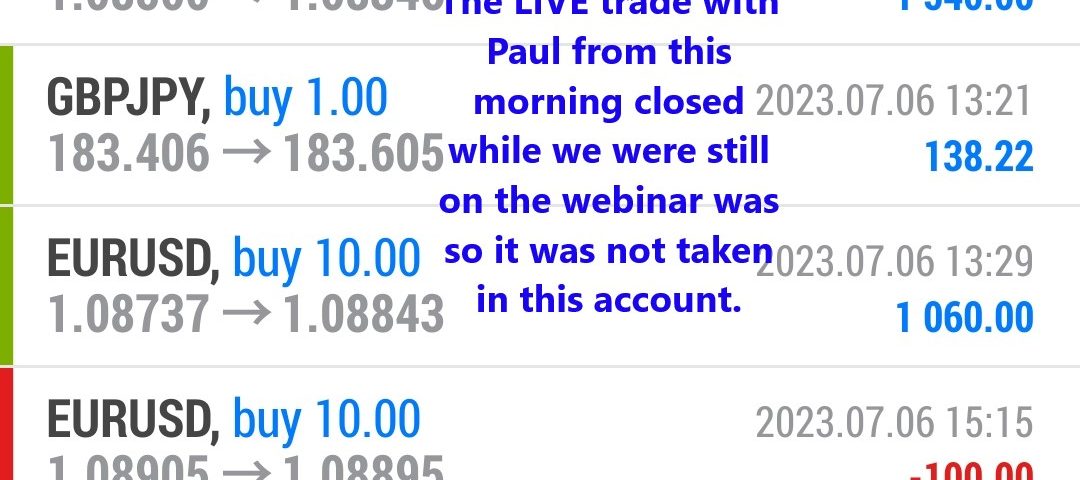
Forex Smart Trade Results, Thursday, July 6, 2023 – $2,457

Forex Smart Trade Results, Wednesday, July 5, 2023 – $1,347
July 24, 2023
Forex Smart Trade Results, Friday, July 7, 2023 – $5,863
July 24, 2023Reviewing Various Technical Indicators.
Let’s continue our discussion from the previous session reviewing various technical indicators.
Aside from the actual profit and loss of each strategy, we included the total pips gained/lost and the max drawdown.
Again, let us just remind you that we DO NOT SUGGEST trading forex without any stop losses.
Always trade with a stop loss or a hedging strategy.
This is just for illustrative purposes only!
Moving on, here are the results of our back test:
| STRATEGY | NUMBER OF TRADES | P/L IN PIPS | P/L IN % | MAX DRAWDOWN |
|---|---|---|---|---|
| Buy And Hold | 1 | -3,416.66 | -3.42 | 25.44 |
| Bollinger Bands | 20 | -19,535.97 | -19.54 | 37.99 |
| MACD | 110 | 3,937.67 | 3.94 | 27.55 |
| Parabolic SAR | 128 | -9,746.29 | -9.75 | 21.96 |
| Stochastic | 74 | -20,716.40 | -20.72 | 30.64 |
| RSI | 8 | -18,716.69 | -18.72 | 34.57 |
| Ichimoku Kinko Hyo | 53 | 30,341.22 | 30.34 | 19.51 |
The data showed that over the past 5-years, the indicator that performed the best on its own was the Ichimoku Kinko Hyo indicator.
It generated a total profit of $30,341, or 30.35%. Over 5 years, that gives us an average of just over 6% per year!
Surprisingly, the rest of the technical indicators were a lot less profitable, with the Stochastic indicator showing a return of negative 20.72%.
Furthermore, all the indicators led to substantial drawdowns of between 20% to 30%.
However, this does not mean that the Ichimoku Kinko Hyo indicator is the best or that technical indicators are useless.
Rather, this just goes to show that they aren’t that useful on their own.

Learn to Day Trade Forex with Company Funds
If you’d like to earn extra income trading on the Forex market, consider learning how to currency trade with Forex Smart Trade. With their super-accurate proprietary trading tools and best-in-the-business, personalized one-on-one training, you’ll be successful. Check out the Forex Smart Trade webinar. It shows one of their trader’s trading and how easy, intuitive, and accurate the tools are. Or try the Forex Smart Trade 14-day introductory trial for just TEN dollars.


