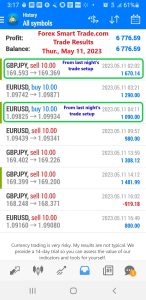
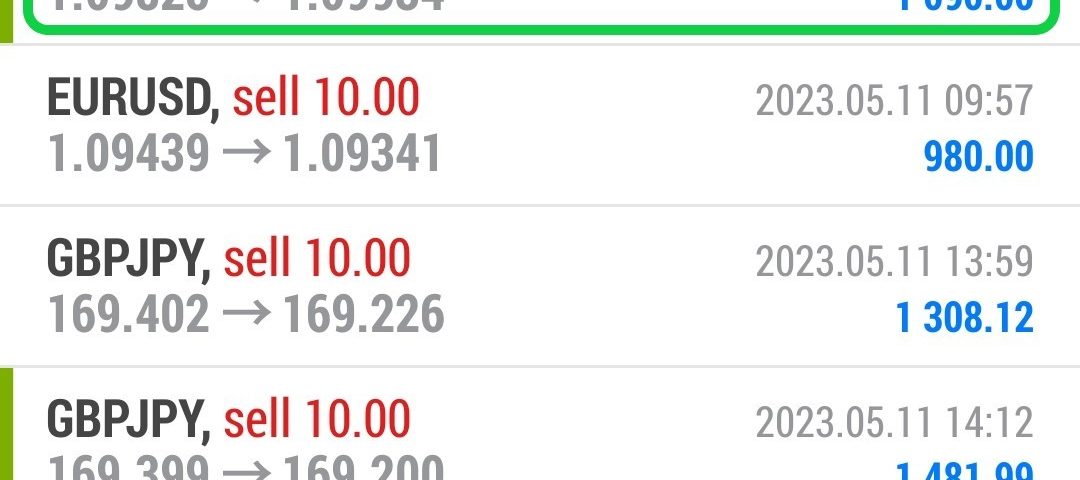
Forex Smart Trade Results, Thursday, May 11, 2023 – $6,776

Forex Smart Trade Results – Wednesday, May 10, 2023 – $9,958
May 21, 2023
Forex Smart Trade Results, Friday, May 12, 2023 – $4,590
May 21, 2023How to Identify Trend Reversals Using Guppy Moving Averages.
Let’s examine how to identify trend reversals using Guppy moving averages.
The crossover of the short- and long-term moving averages represents trend reversals.
If the short-term EMAs cross ABOVE the long-term moving averages, this is a bullish crossover.
The bullish crossover indicates that a bullish reversal has occurred.
If the short-term EMAs cross BELOW the longer-term ones, this is a bearish crossover.
The bearish crossover suggests a bearish reversal is occurring.
How to Identify a Lack of Trend
When the moving averages between the two groups are close together and approximately parallel.
This demonstrates that the shis ort-term market sentiment and long-term trend are largely in agreement.
When both groups of EMAs are moving horizontally, or mostly moving sideways and heavily intertwined, it means the price lacks a trend.
In the chart above, see how when the red and blue groups of EMAs are intertwined.
The price is directionless, simply moving up and down within a range.
This current price action is more suitable for range trading.
As a trend trader, it would make sense to sit out and wait for better conditions.
When the market is sideways, trend traders sit on the sidelines.

Learn Currency Trading
If you’d like to earn extra income trading on the Forex market, consider learning how to currency trade with Forex Smart Trade. With their super-accurate proprietary trading tools and best-in-the-business, personalized one-on-one training, you’ll be successful. Check out the Forex Smart Trade webinar. It shows one of their trader’s trading and how easy, intuitive, and accurate the tools are. Or try the Forex Smart Trade 14-day introductory trial for just TEN dollars.


