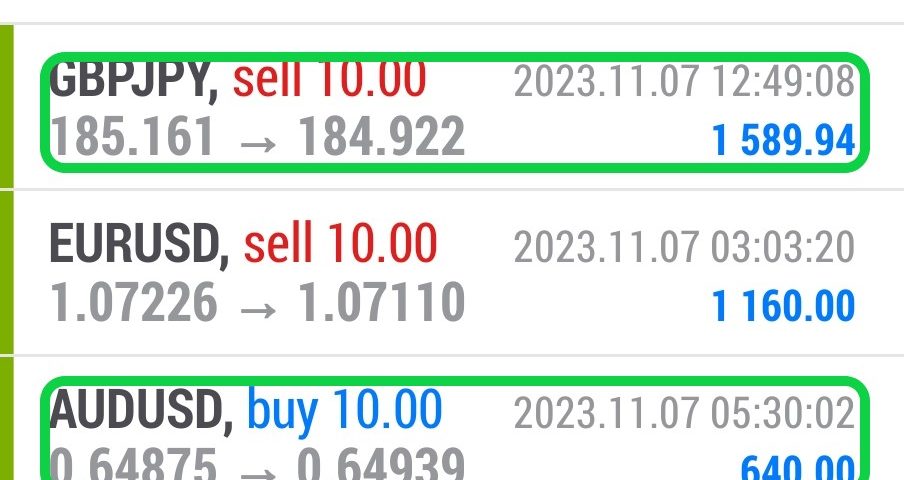
Forex Smart Trade Results, Tuesday, November 7, 2023 – $9,815

Forex Smart Trade Results, Monday, November 6, 2023 – $5,866
November 11, 2023
Forex Smart Trade Results, Wednesday, November 8, 2023 – $5,754
November 11, 2023More Rules for Trading Divergences.
Let’s continue reviewing rules for trading divergences.
2. Draw lines on successive tops and bottoms
Okay now that you got some action (recent price action that is), look at it. Remember, you’ll only see one of four things: a higher high, a flat high, a lower low, or a flat low.
Now draw a line backward from that high or low to the previous high or low. It HAS to be on successive major tops/bottoms.
If you see any little bumps or dips between the two major highs/lows, do what you do when your significant other shouts at you – ignore it.
3. Connect TOPS and BOTTOMS only
Once you see two swing highs are established, you connect to the TOPS.
If two lows are made, you connect the BOTTOMS.
4. Keep Your Eyes on the Price
So you’ve connected either two tops or two bottoms with a trend line.
Now look at your preferred technical indicator and compare it to price action.
Whichever indicator you use, remember you are comparing its TOPS or BOTTOMS.
Some indicators, such as MACD or Stochastic, have multiple lines all up on each other like teenagers with raging hormones. Don’t worry about what these kids are doing.
5. Be Consistent With Your Swing Highs and Lows
If you draw a line connecting two highs on price, you MUST draw a line connecting the two highs on the indicator as well. Ditto for lows also.
If you draw a line connecting two lows on price, you MUST draw a line connecting two lows on the indicator. They have to match!

Learn to Trade Forex
If you’d like to earn extra income trading on the Forex market, consider learning how to currency trade with Forex Smart Trade. With their super-accurate proprietary trading tools and best-in-the-business, personalized one-on-one training, you’ll be successful. Check out the Forex Smart Trade webinar. It shows one of their trader’s trading and how easy, intuitive, and accurate the tools are. Or try the Forex Smart Trade 14-day introductory trial for just TEN dollars.


