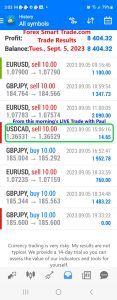
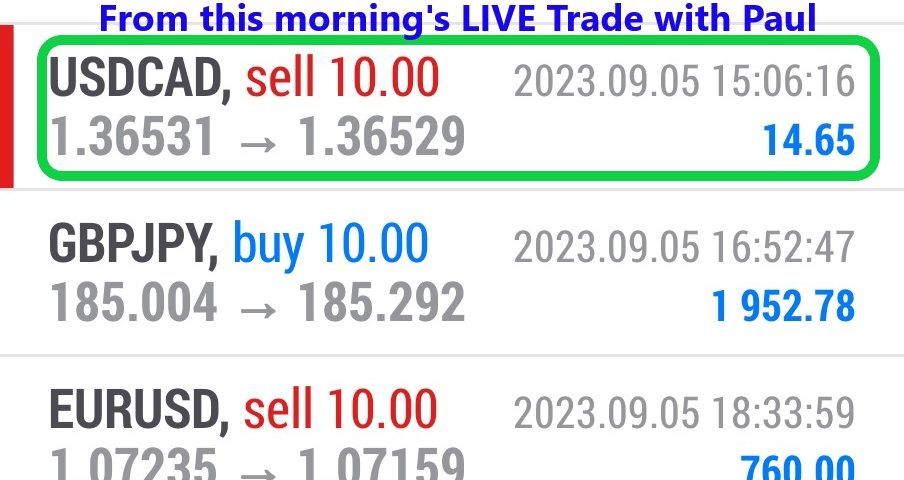
Forex Smart Trade Results, Tuesday, September 5, 2023 – $8,404

Forex Smart Trade Results, Monday, September 4, 2023 – $2,229
September 9, 2023
Forex Smart Trade Results, Wednesday, September 6, 2023 – ($ 1,240)
September 9, 2023Fibonacci Pivot Point.
Let’s look at a Fibonacci pivot point.
R3 = PP + ((High – Low) x 1.000)
R2 = PP + ((High – Low) x .618)
R1 = PP + ((High – Low) x .382)
PP = (H + L + C) / 3
S1 = PP – ((High – Low) x .382)
S2 = PP – ((High – Low) x .618)
S3 = PP – ((High – Low) x 1.000)
C – Closing Price, H – High, L – Low
Fibonacci pivot point levels are determined by first calculating the pivot point like you would the standard method.
Next, multiply the previous day’s range with its corresponding Fibonacci level. Most traders use the 38.2%, 61.8% and 100% retracements in their calculations.
Finally, add or subtract the figures you get to the pivot point and voila, you’ve got your Fibonacci pivot point levels!
Look at the chart below to see how the levels calculated through the Fibonacci method (solid lines) differ from those calculated through the standard method (dotted lines).
The logic behind this is that many traders like using the Fibonacci ratios. People use it for retracement levels, moving averages, etc.
Why not use it for pivot points as well?
Remember that both Fibonacci and pivot point levels are used to find support and resistance.
With so many traders looking at these levels, they can actually become self-fulfilling.

Learn How To Successfully Trade Forex
If you’d like to earn extra income trading on the Forex market, consider learning how to currency trade with Forex Smart Trade. With their super-accurate proprietary trading tools and best-in-the-business, personalized one-on-one training, you’ll be successful. Check out the Forex Smart Trade webinar. It shows one of their trader’s trading and how easy, intuitive, and accurate the tools are. Or try the Forex Smart Trade 14-day introductory trial for just TEN dollars.


