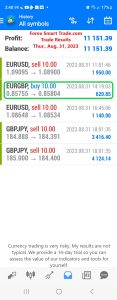
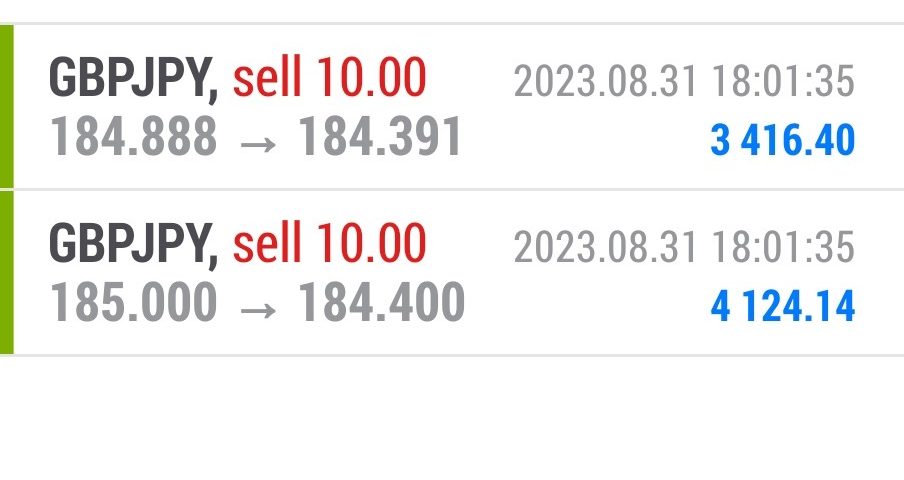
Forex Smart Trade Results, Thursday, August 31, 2023 – $11,151

Forex Smart Trade Results, Wednesday, August 30, 2023 – $8,737
September 4, 2023
Forex Smart Trade Results, Friday, September 1, 2023 – $10,853
September 4, 2023Measuring Market Sentiment with Pivot Points.
Let’s continue examining measuring market sentiment with pivot points.
Let’s take a look at a chart of GBP/USD.
In the chart above, we see that the price tested the pivot point, which held as a resistance level. Next thing you know, the pair keeps going lower and lower.
If you had taken the clue that the price remained below the pivot point and sold the pair, you would have made some nice moolah.
GBP/USD dropped almost 300 pips!
Of course, it doesn’t always work out like this.
There are times when you think that forex traders are bearish on a pair, only to see that the pair reverses and breaks through to the top!
Explanation
In this example, if you saw the price breaking lower from the pivot point and sold, you would have had a sad, sad day.
Later on, during the European session, EUR/USD popped higher, eventually breaking through the pivot point.
What’s more, the pair stayed above the pivot point, showing how buyers were rocking’ away.
Lesson
The lesson here?
Traders are fickle!
How forex traders feel about a currency can shift dramatically from day to day, even session to session.
This is why you cannot simply buy when the price is above the pivot point or sell when it is below it.
Instead, if you choose to use pivot point analysis in this way, you should combine it with other indicators to help you determine overall market sentiment.

Best Forex Training Course
If you’d like to earn extra income trading on the Forex market, consider learning how to currency trade with Forex Smart Trade. With their super-accurate proprietary trading tools and best-in-the-business, personalized one-on-one training, you’ll be successful. Check out the Forex Smart Trade webinar. It shows one of their trader’s trading and how easy, intuitive, and accurate the tools are. Or try the Forex Smart Trade 14-day introductory trial for just TEN dollars.


