Forex Smart Trade Results, Tue., Dec. 24, 2024: $1,433

Forex Smart Trade Results, Mon., Dec. 23, 2024: $1,546
January 11, 2025
Forex Smart Trade Results, Wed., Dec. 25, 2024: Christmas Day, Markets Closed
January 11, 2025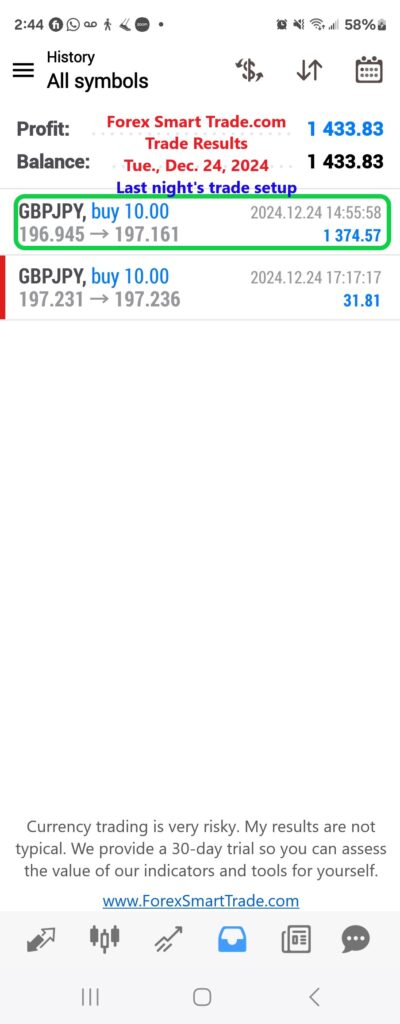
Types of Position Trading.
While fundamental analysis plays a much larger role for position traders, that doesn’t mean that technical analysis isn’t used.
Position traders tend to use both fundamental and technical analysis to evaluate potential trends.
Here are some trading strategies utilizing technical analysis that position traders use:
Trend Trading using Moving Averages (MA)
The 50-day moving average (MA) and 200-day moving average (MA) indicator is a significant technical indicator for position traders.
The reason for this is due to the fact these moving averages illustrate significant long-term trends.
When the 50-day MA intersects with 200-day MA, this signals the potential of a new long-term trend.
When the 50-day MA crosses below the 200-day MA, it is known as the “Death Cross“.
When the 50-day MA crosses above the 200-day MA, it is known as the “Golden Cross“.
These longer-term MAs are popular chart indicators for position traders.
Support and Resistance (S&R) Trading
Support and resistance levels can signal where the price is headed, letting position traders know whether to open or close a position.
A support level is a price level that, historically, does not fall below. These “historical” support levels can hold for years.
A resistance level is a price level that, historically, tends not to be able to break. These “historical” resistance levels can also hold for years.
If position traders expect a long-term resistance hold, they can close out their positions before unrealized profits start melting away.
They may also enter long positions at historical support levels if they expect a long-term trend to hold and continue upward at this point.
This strategy requires that traders analyze chart patterns. When analyzing the chart, position traders consider three factors when trying to identify support and resistance levels.
- The historic price is the most reliable source when identifying support and resistance. During periods of significant up or down in a market, recurring support and resistance levels are easy to spot.
- Previous support and resistance levels can indicate future levels. It is not unusual for a resistance level to become a future support level once it has been broken.
- Technical indicators like moving averages and Fibonacci retracement provide dynamic support and resistance levels that move as the price moves.
Learn to Day Trade Forex
If you’d like to earn extra income trading on the Forex market, consider learning how to currency trade with Forex Smart Trade. With their super-accurate proprietary trading tools and best-in-the-business, personalized one-on-one training, you’ll be successful. Check out the Forex Smart Trade webinar. It shows one of their trader’s trading and how easy, intuitive, and accurate the tools are. Or try the Forex Smart Trade Introductory Trading Trial for just TEN dollars.
Currency trading is very risky. My results are not typical. We provide a 30-day trial so you can assess the value of our indicators and tools for yourself.