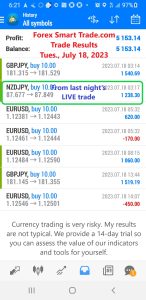
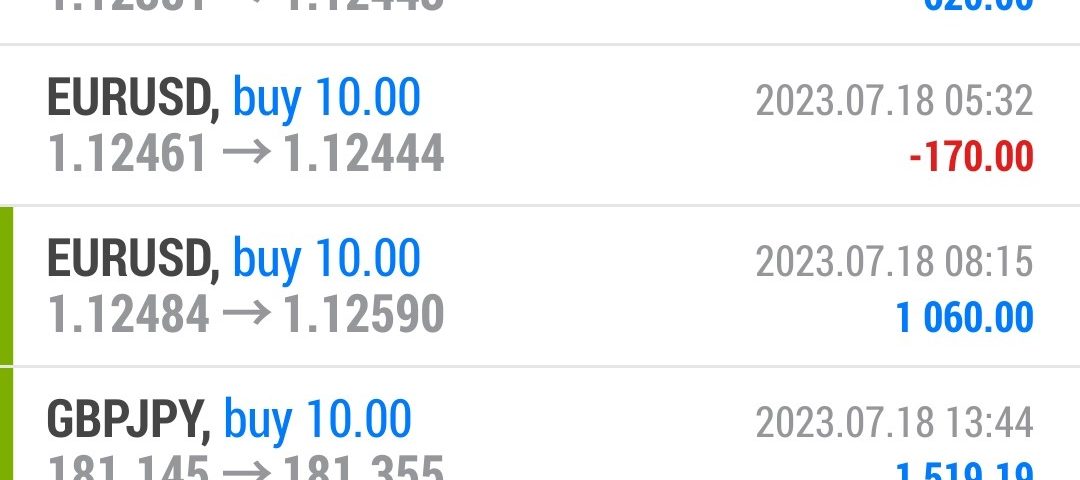
Forex Smart Trade Results, Tuesday, July 18, 2023 – $5,153

Forex Smart Trade Results, Monday, July 17, 2023 – $0 – Traveling & Unable to Trade
August 12, 2023
Forex Smart Trade Results, Wednesday, July 19, 2023 – $4,632
August 12, 2023When Oscillators Don’t Work.
In our previous example, we saw a situation when oscillators don’t work.
What happened to such a good set of indicators?
The answer lies in the method of calculation for each one.
Stochastic is based on the high-to-low range of the time period (in this case, it’s hourly), yet it doesn’t account for changes from one hour to the next.
The Relative Strength Index (RSI) uses the change from one closing price to the next.
Parabolic SAR has its own unique calculations that can further cause conflict.
That’s the nature of oscillators. They assume that a particular price movement always results in the same reversal.
Of course, that’s hogwash.

While being aware of why a leading indicator may be wrong, there’s no way to avoid them.
If you’re getting mixed signals, you’re better off doing nothing than taking a “best guess”.
If a chart doesn’t meet all your criteria, don’t force the trade!

Learn to Trade Forex
If you’d like to earn extra income trading on the Forex market, consider learning how to currency trade with Forex Smart Trade. With their super-accurate proprietary trading tools and best-in-the-business, personalized one-on-one training, you’ll be successful. Check out the Forex Smart Trade webinar. It shows one of their trader’s trading and how easy, intuitive, and accurate the tools are. Or try the Forex Smart Trade 14-day introductory trial for just TEN dollars.


