Trade Results
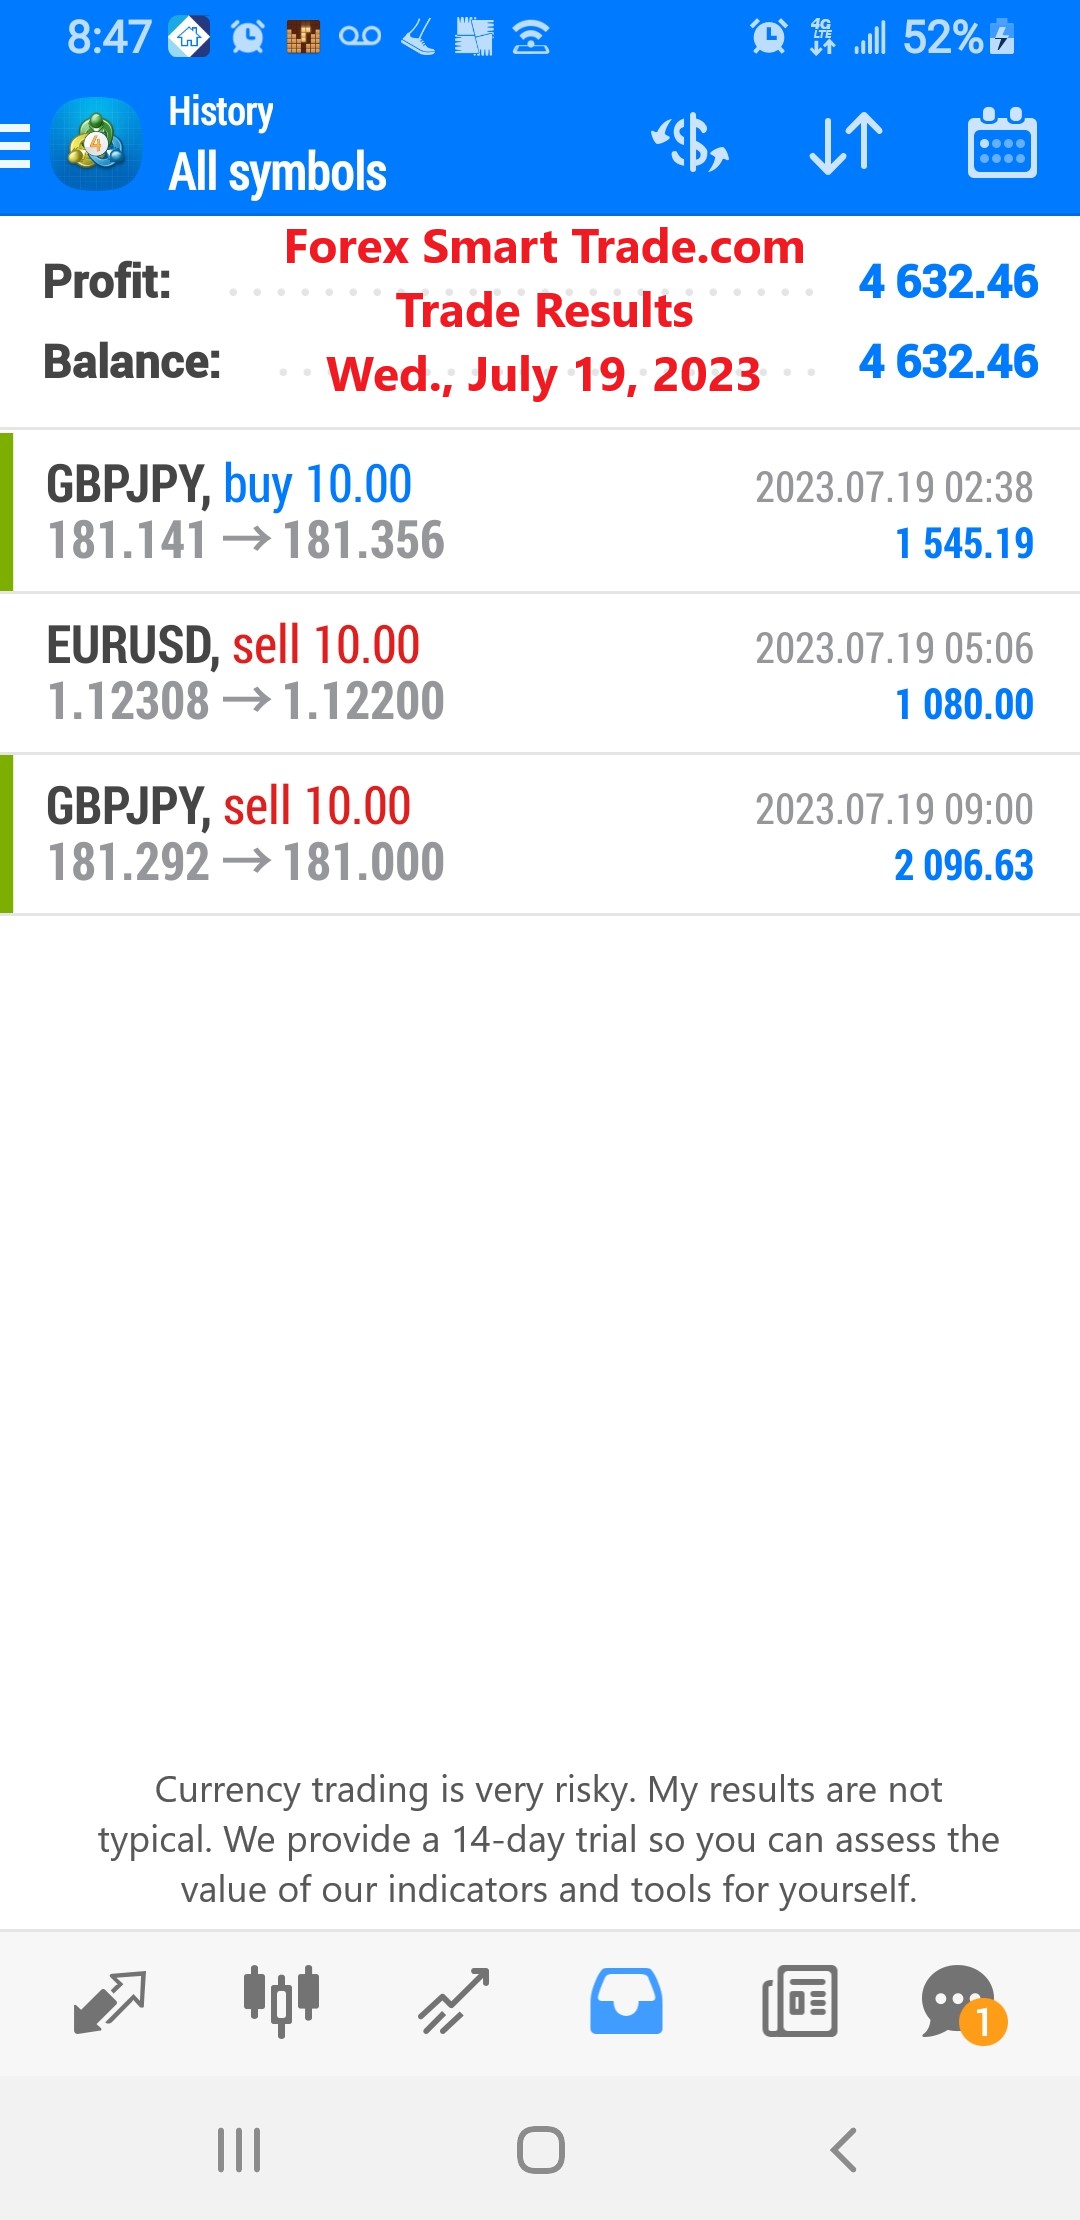
Forex Smart Trade Results, Wednesday, July 19, 2023 – $4,632
How to Use MACD to Confirm a Trend. Let’s see how to use MACD to confirm a trend. Spotting a Trend So how do we spot […]

Forex Smart Trade Results, Tuesday, July 18, 2023 – $5,153
When Oscillators Don’t Work. In our previous example, we saw a situation when oscillators don’t work. What happened to such a good set of indicators? The […]
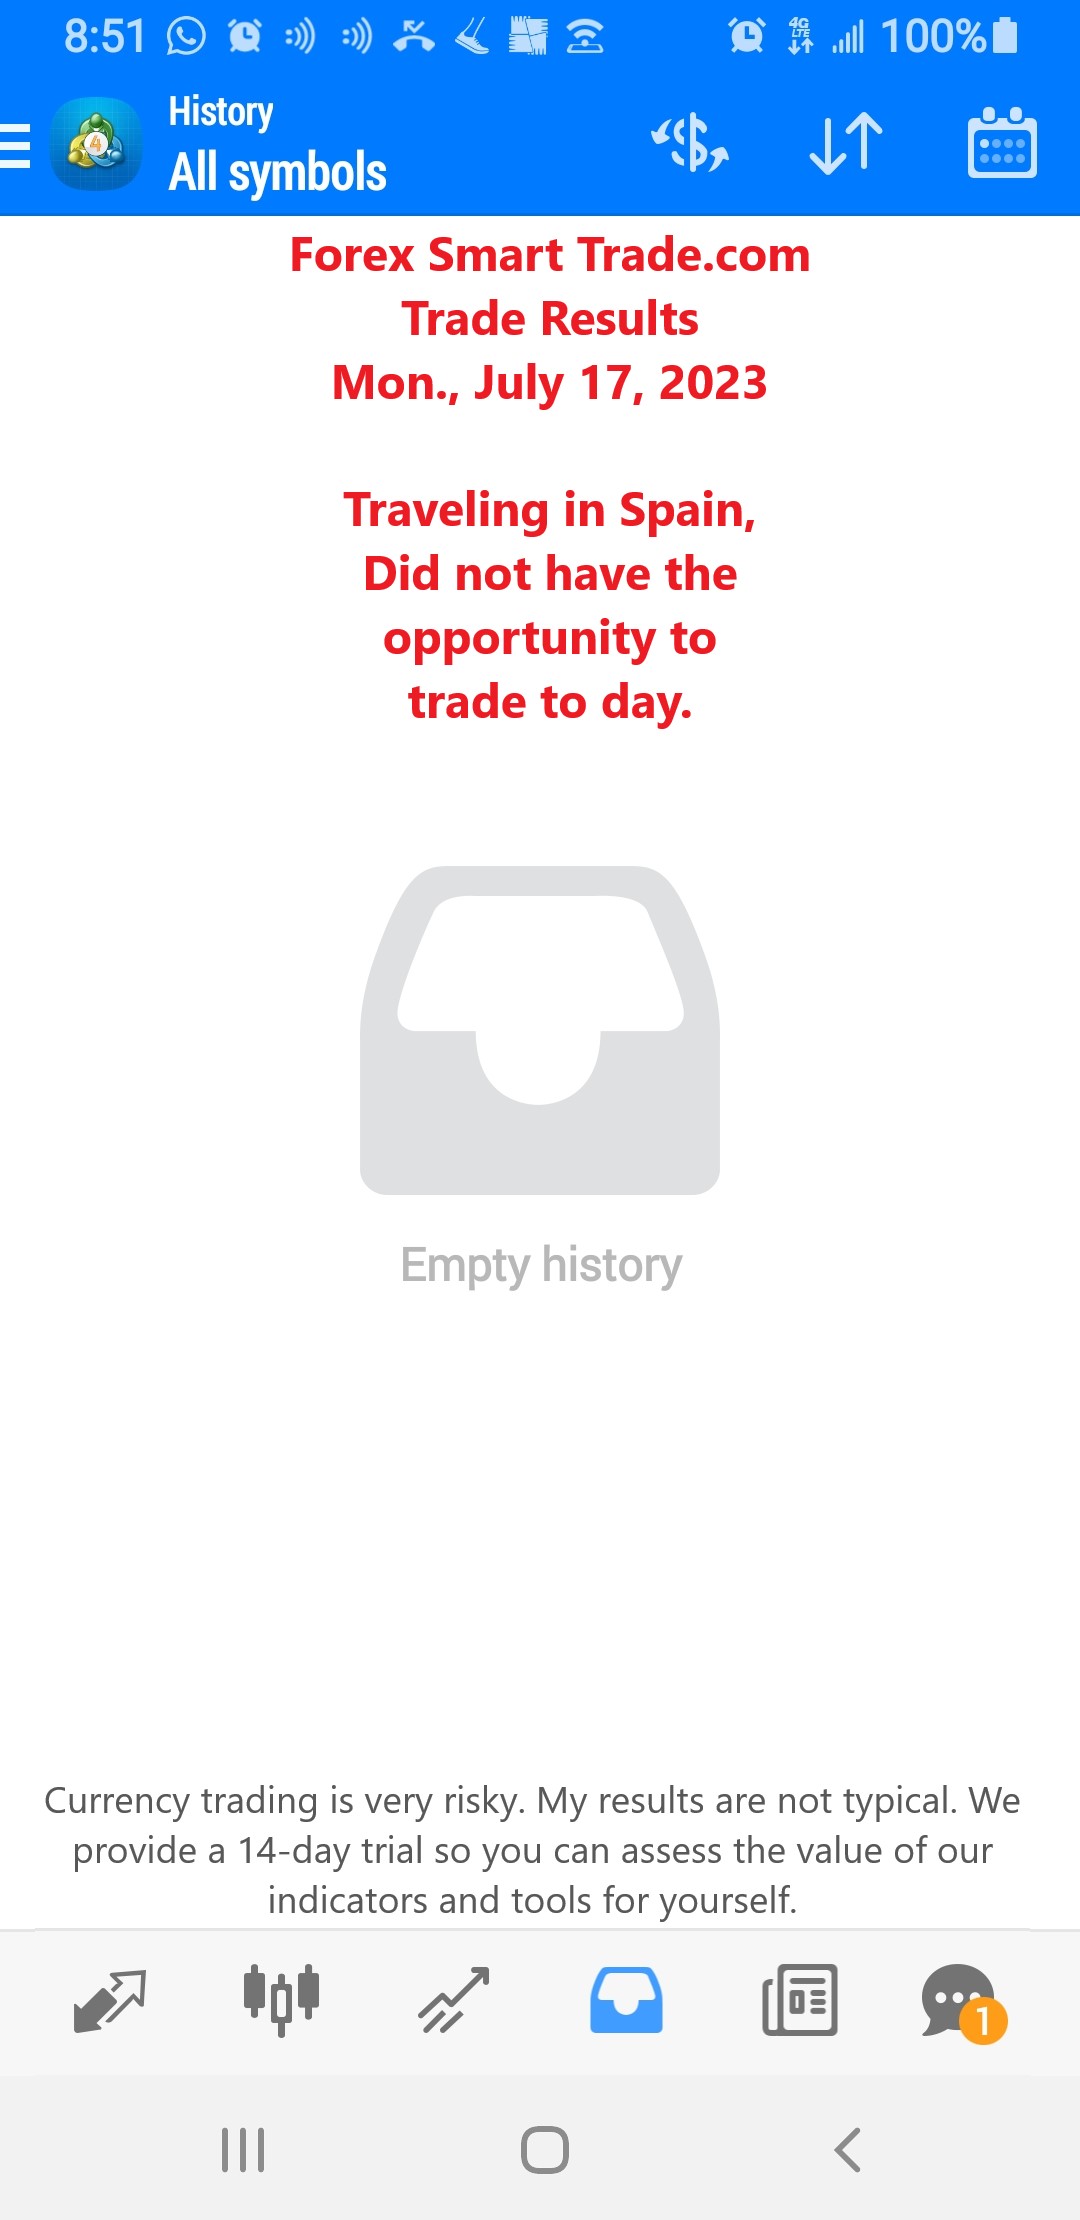
Forex Smart Trade Results, Monday, July 17, 2023 – $0 – Traveling & Unable to Trade
Trading with Oscillators. Let’s continue our examination of trading with oscillators. Each of these indicators is designed to signal a possible trend reversal, where the previous trend has […]
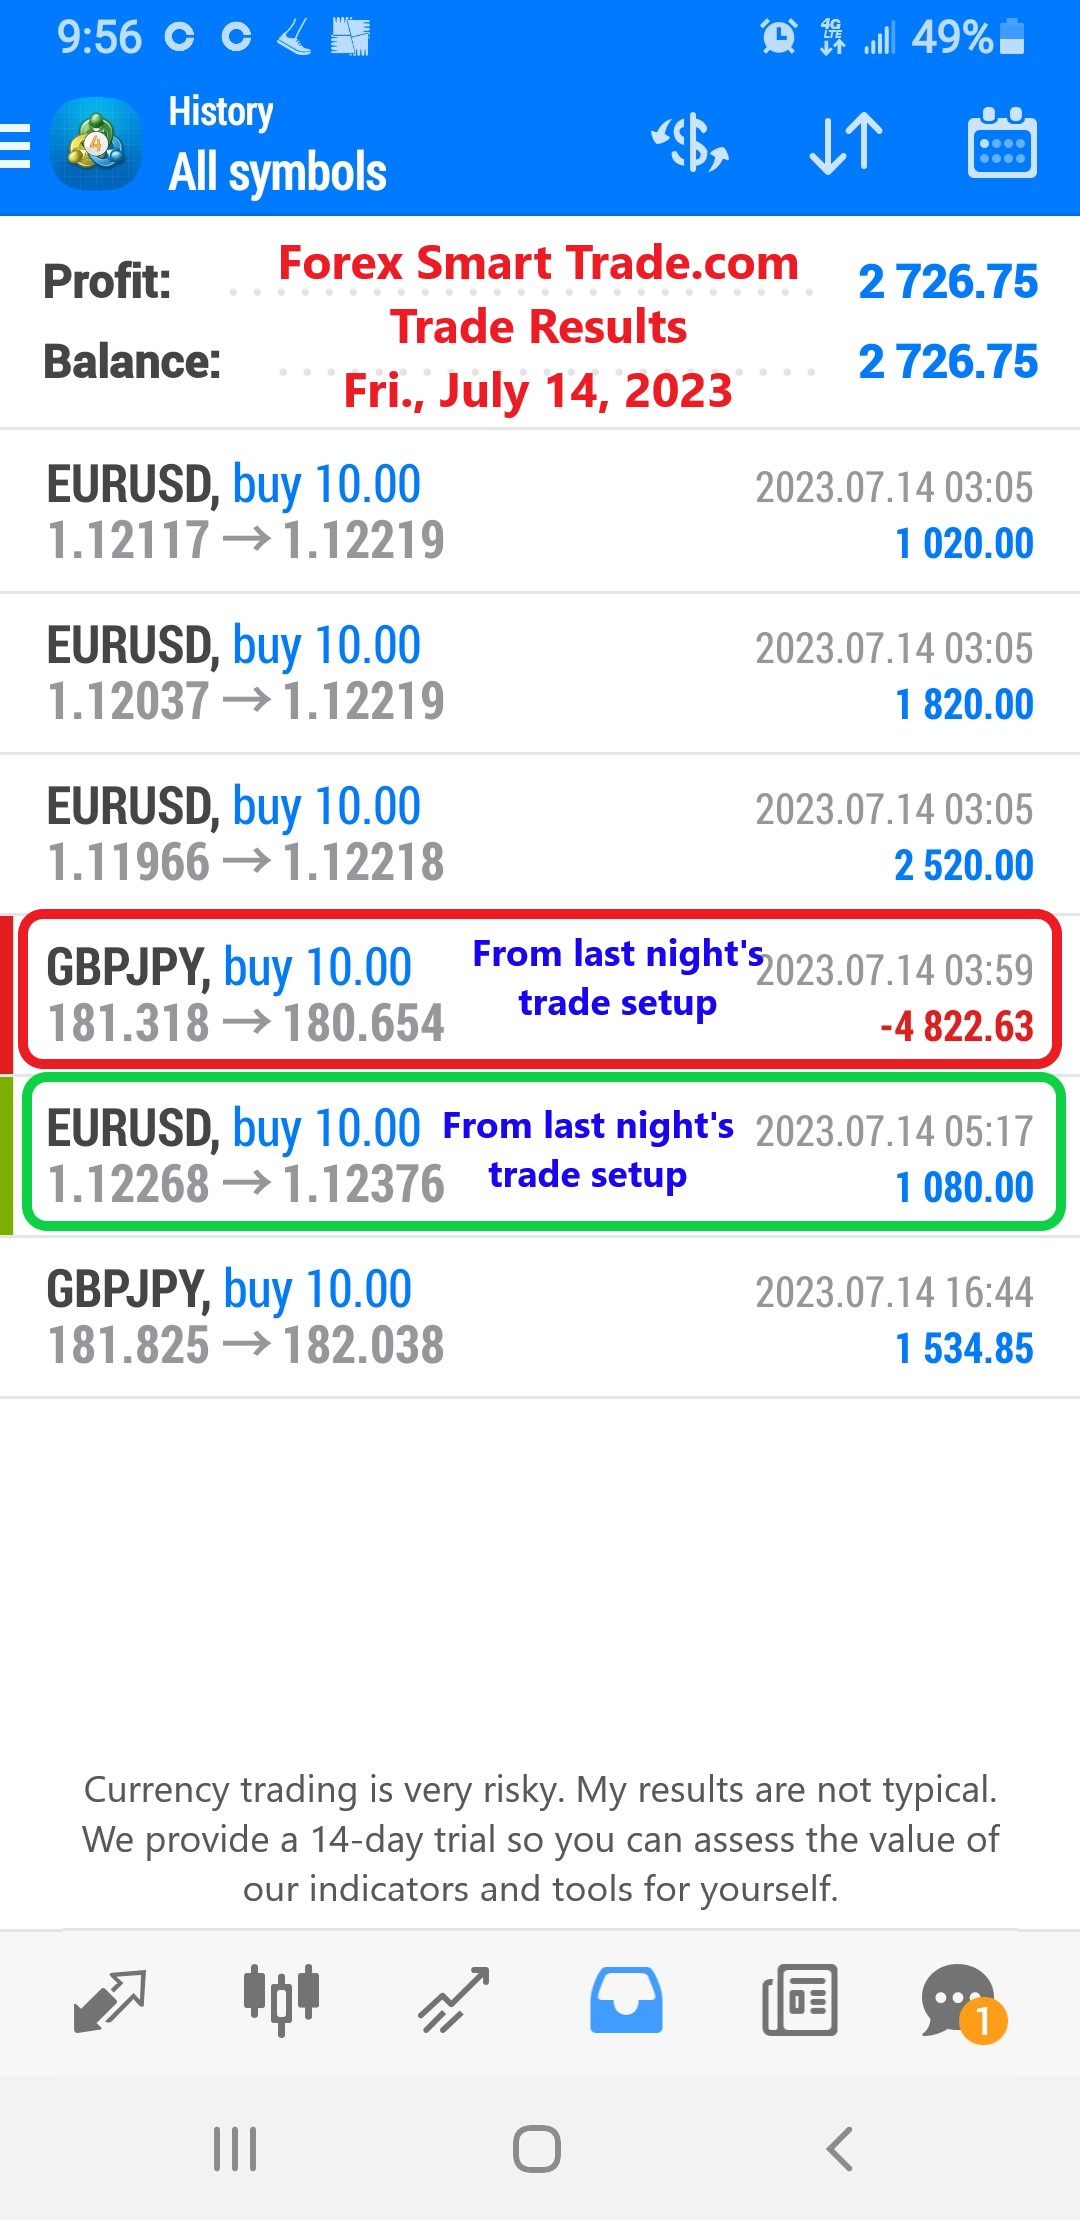
Forex Smart Trade Results, Friday, July 14, 2023 – $2,726
How to Use Oscillators to Warn You of the End of a Trend. Let’s look at how to use oscillators to warn you of the end […]
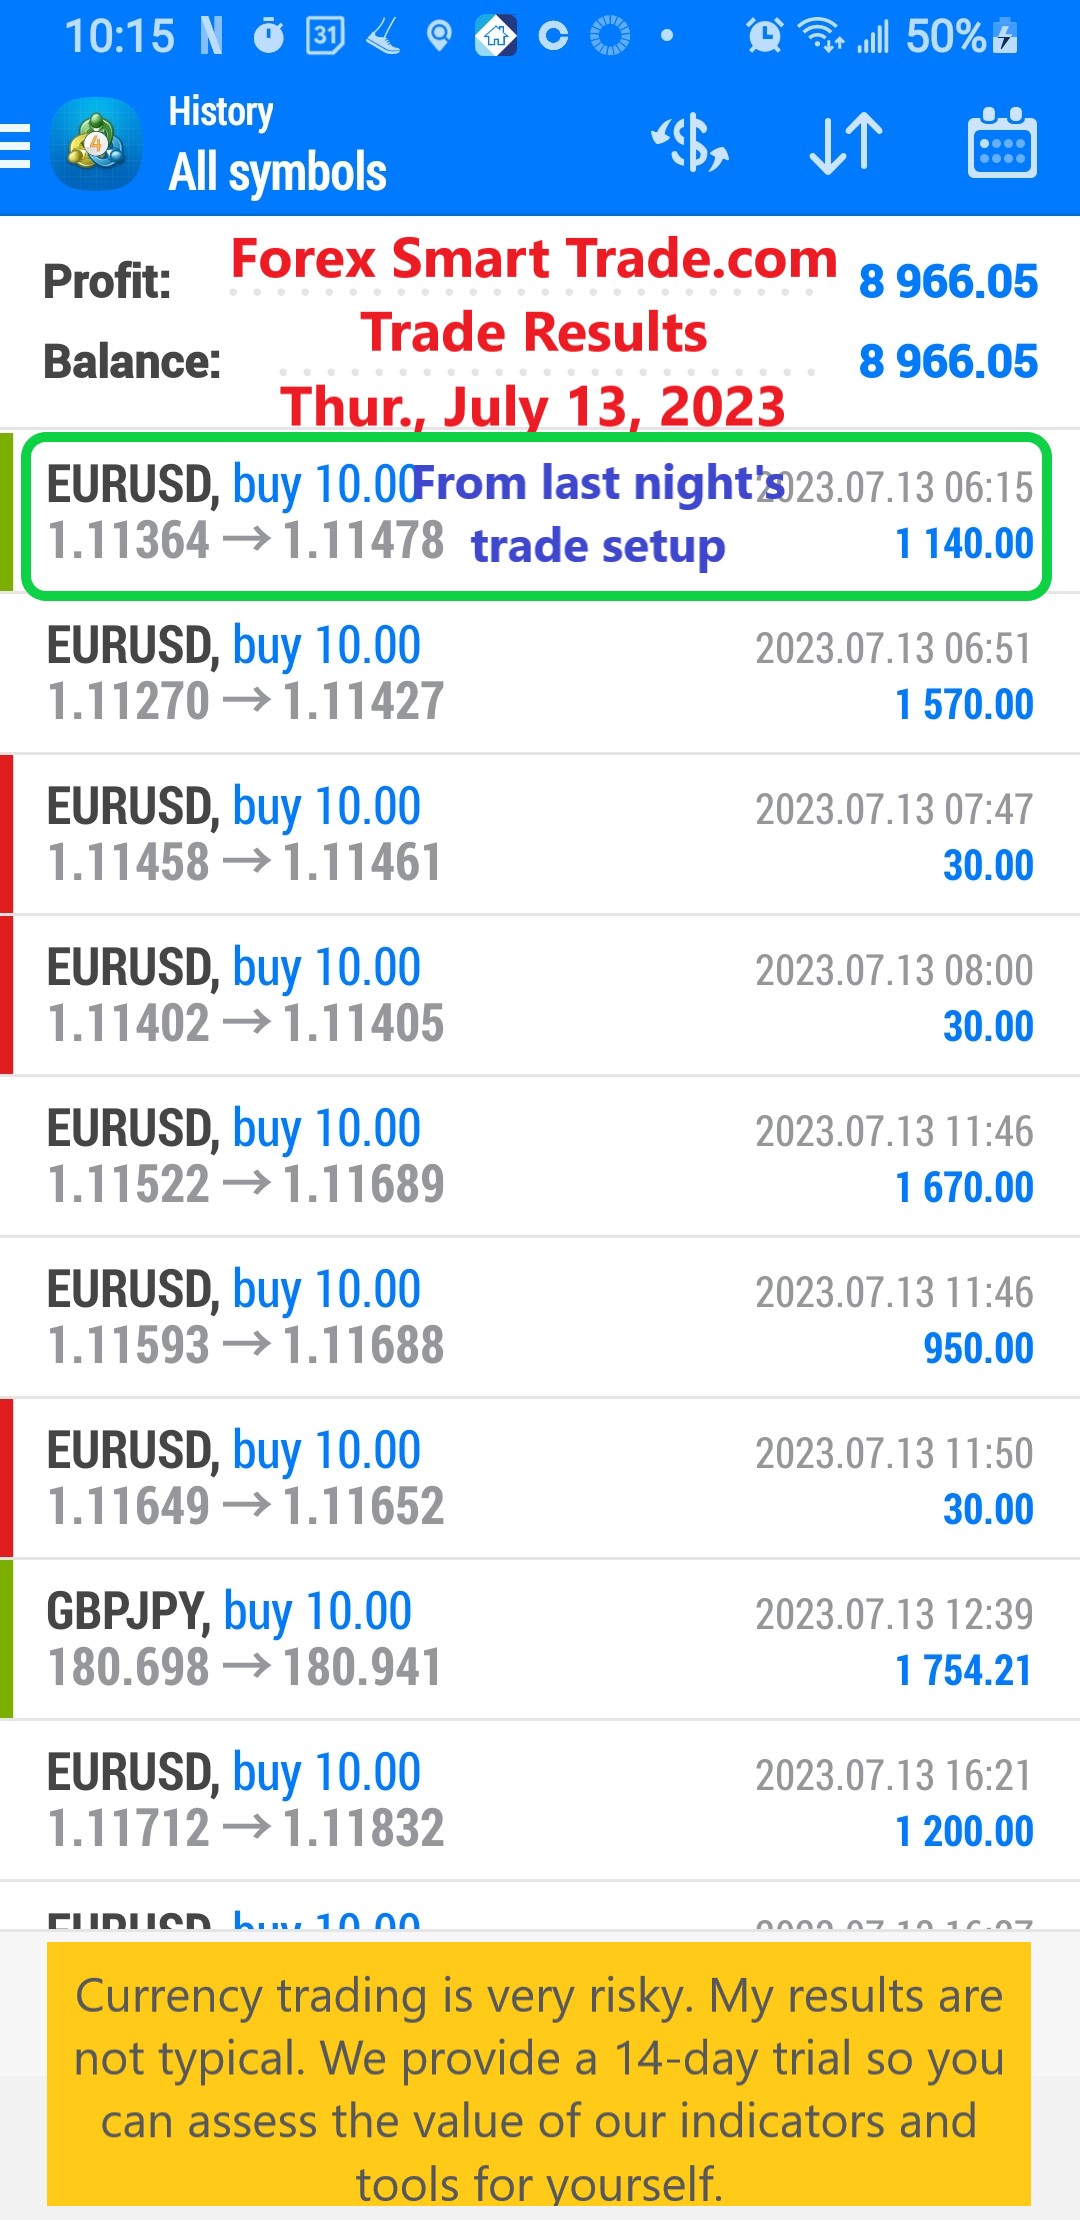
Forex Smart Trade Results, Thursday, July 13, 2023 – $8,966
Leading and Lagging Indicators. Let’s continue our discussion on leading and lagging indicators. You would “catch” the entire trend every single time IF the leading indicator […]
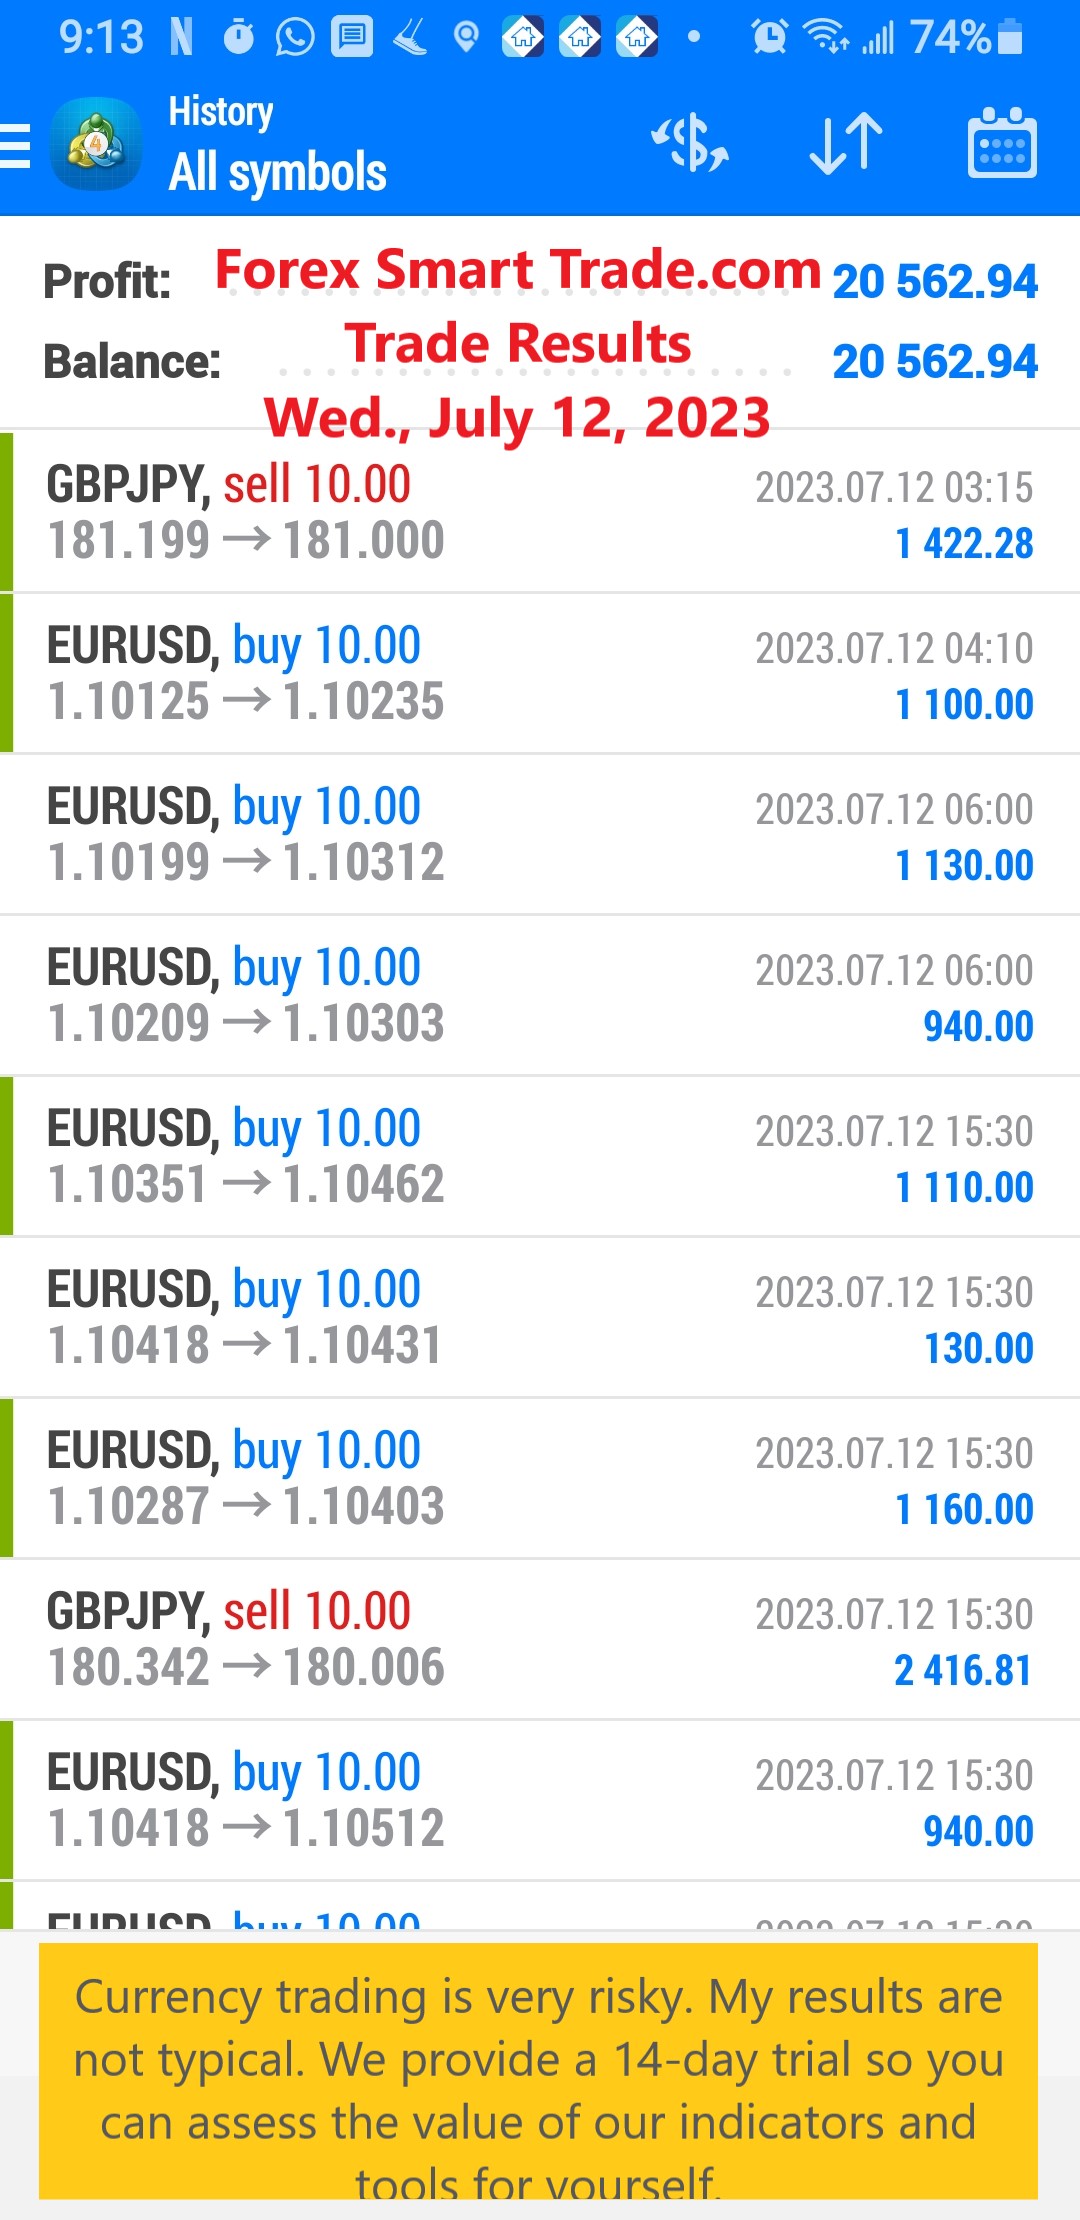
Forex Smart Trade Results, Wednesday, July 12, 2023 – $20,562
Leading versus Lagging Indicators. Let’s examine leading versus lagging indicators. We’ve already covered a lot of tools that can help you analyze potential trending and range-bound […]

Forex Smart Trade Results, Tuesday, July 11, 2023 – ($7,322)
Continued. Summary of Forex Indicators. Let’s continue and finish our summary of forex indicators. Ichimoku Kinko Hyo IKH or Ichimoku Kinko Hyo is an indicator that […]

Forex Smart Trade Results, Monday, July 10, 2023 – $3,176
Summary of Chart Indicators. Let’s continue with our summary of chart indicators. Parabolic SAR They make this indicator to spot trend reversals, hence the name Parabolic […]
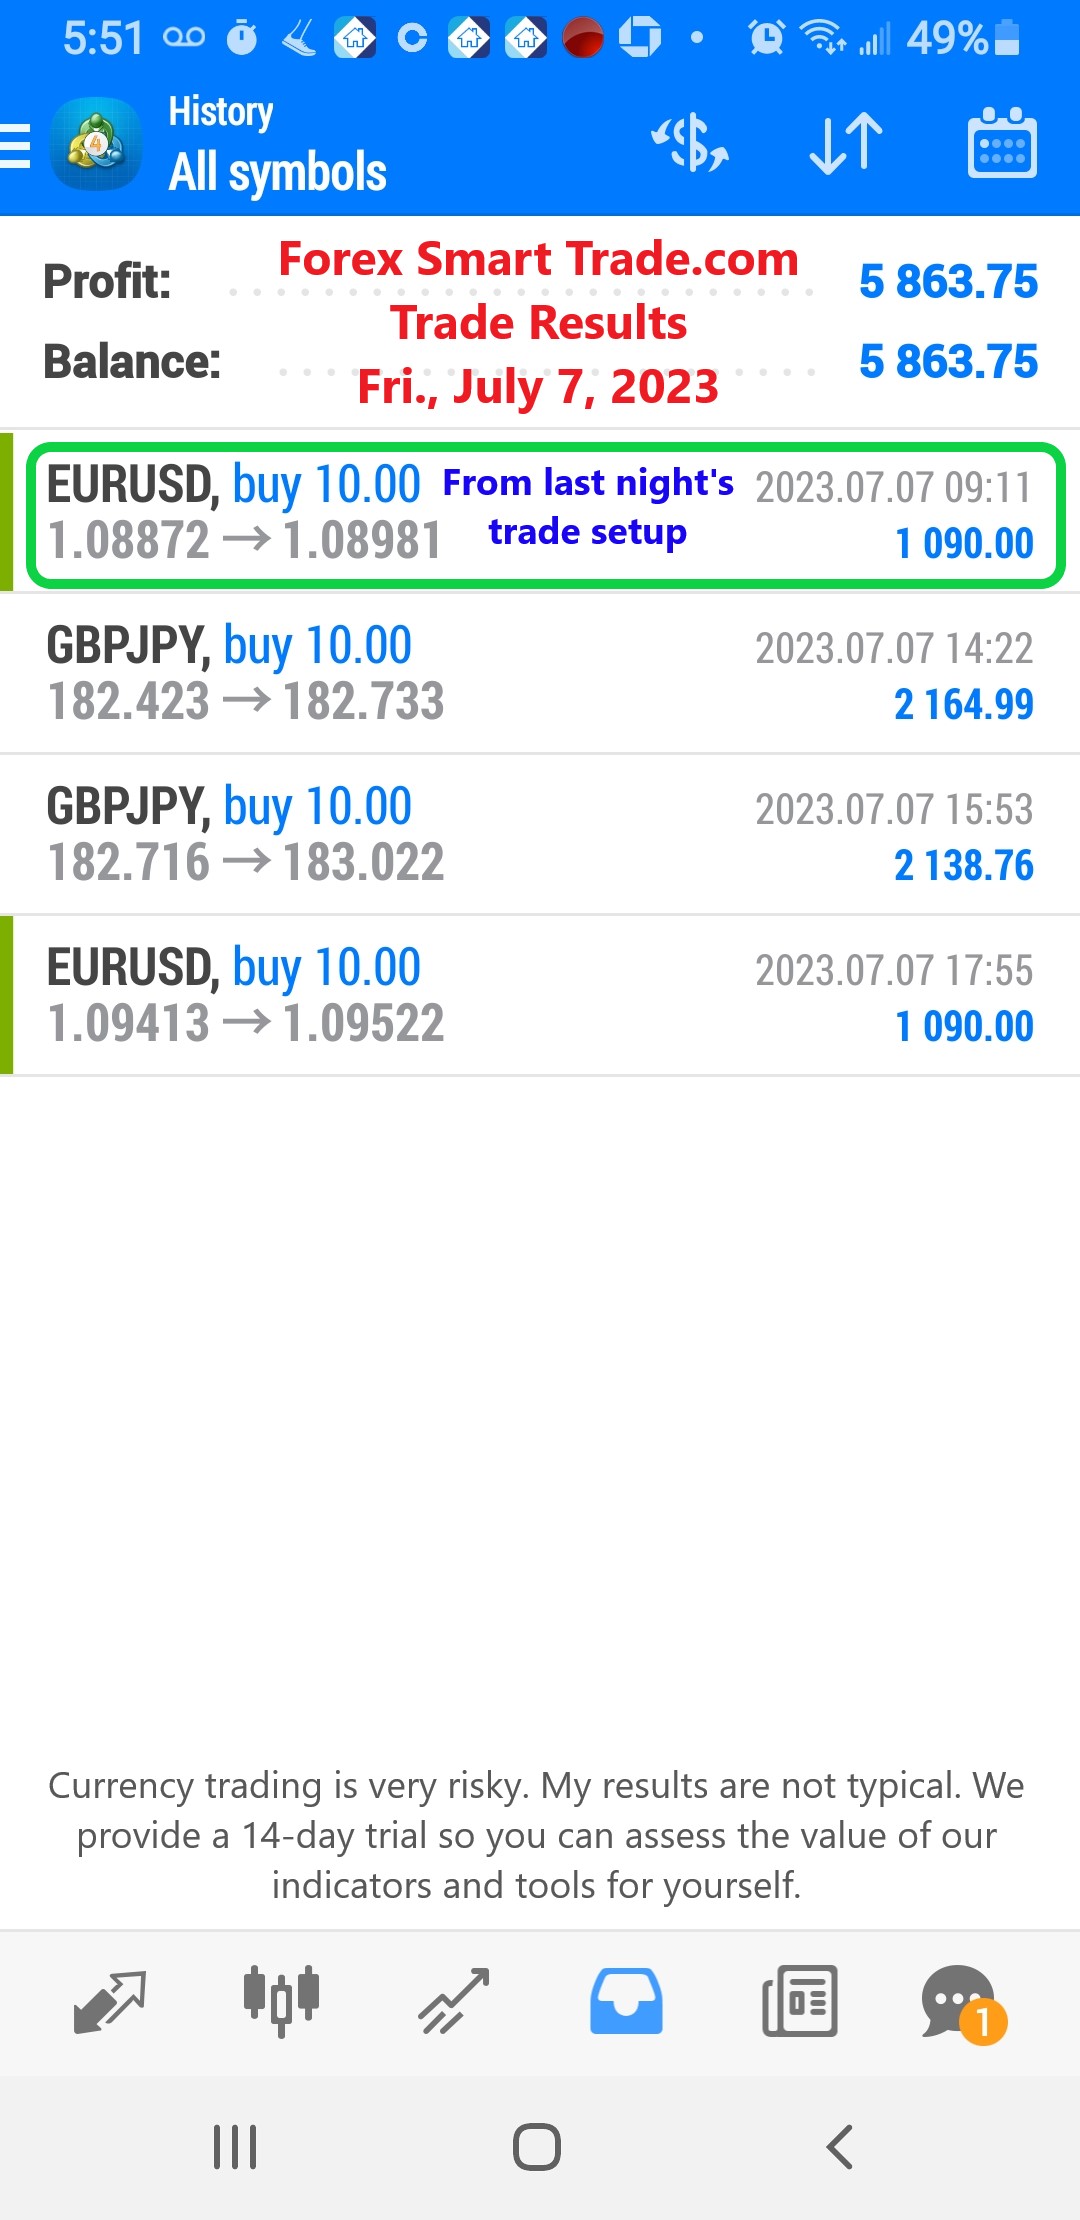
Forex Smart Trade Results, Friday, July 7, 2023 – $5,863
Summary: Popular Chart Indicators. Everything you learn about trading is like a tool that is being added to your Forex trader’s toolbox. Your tools will give […]
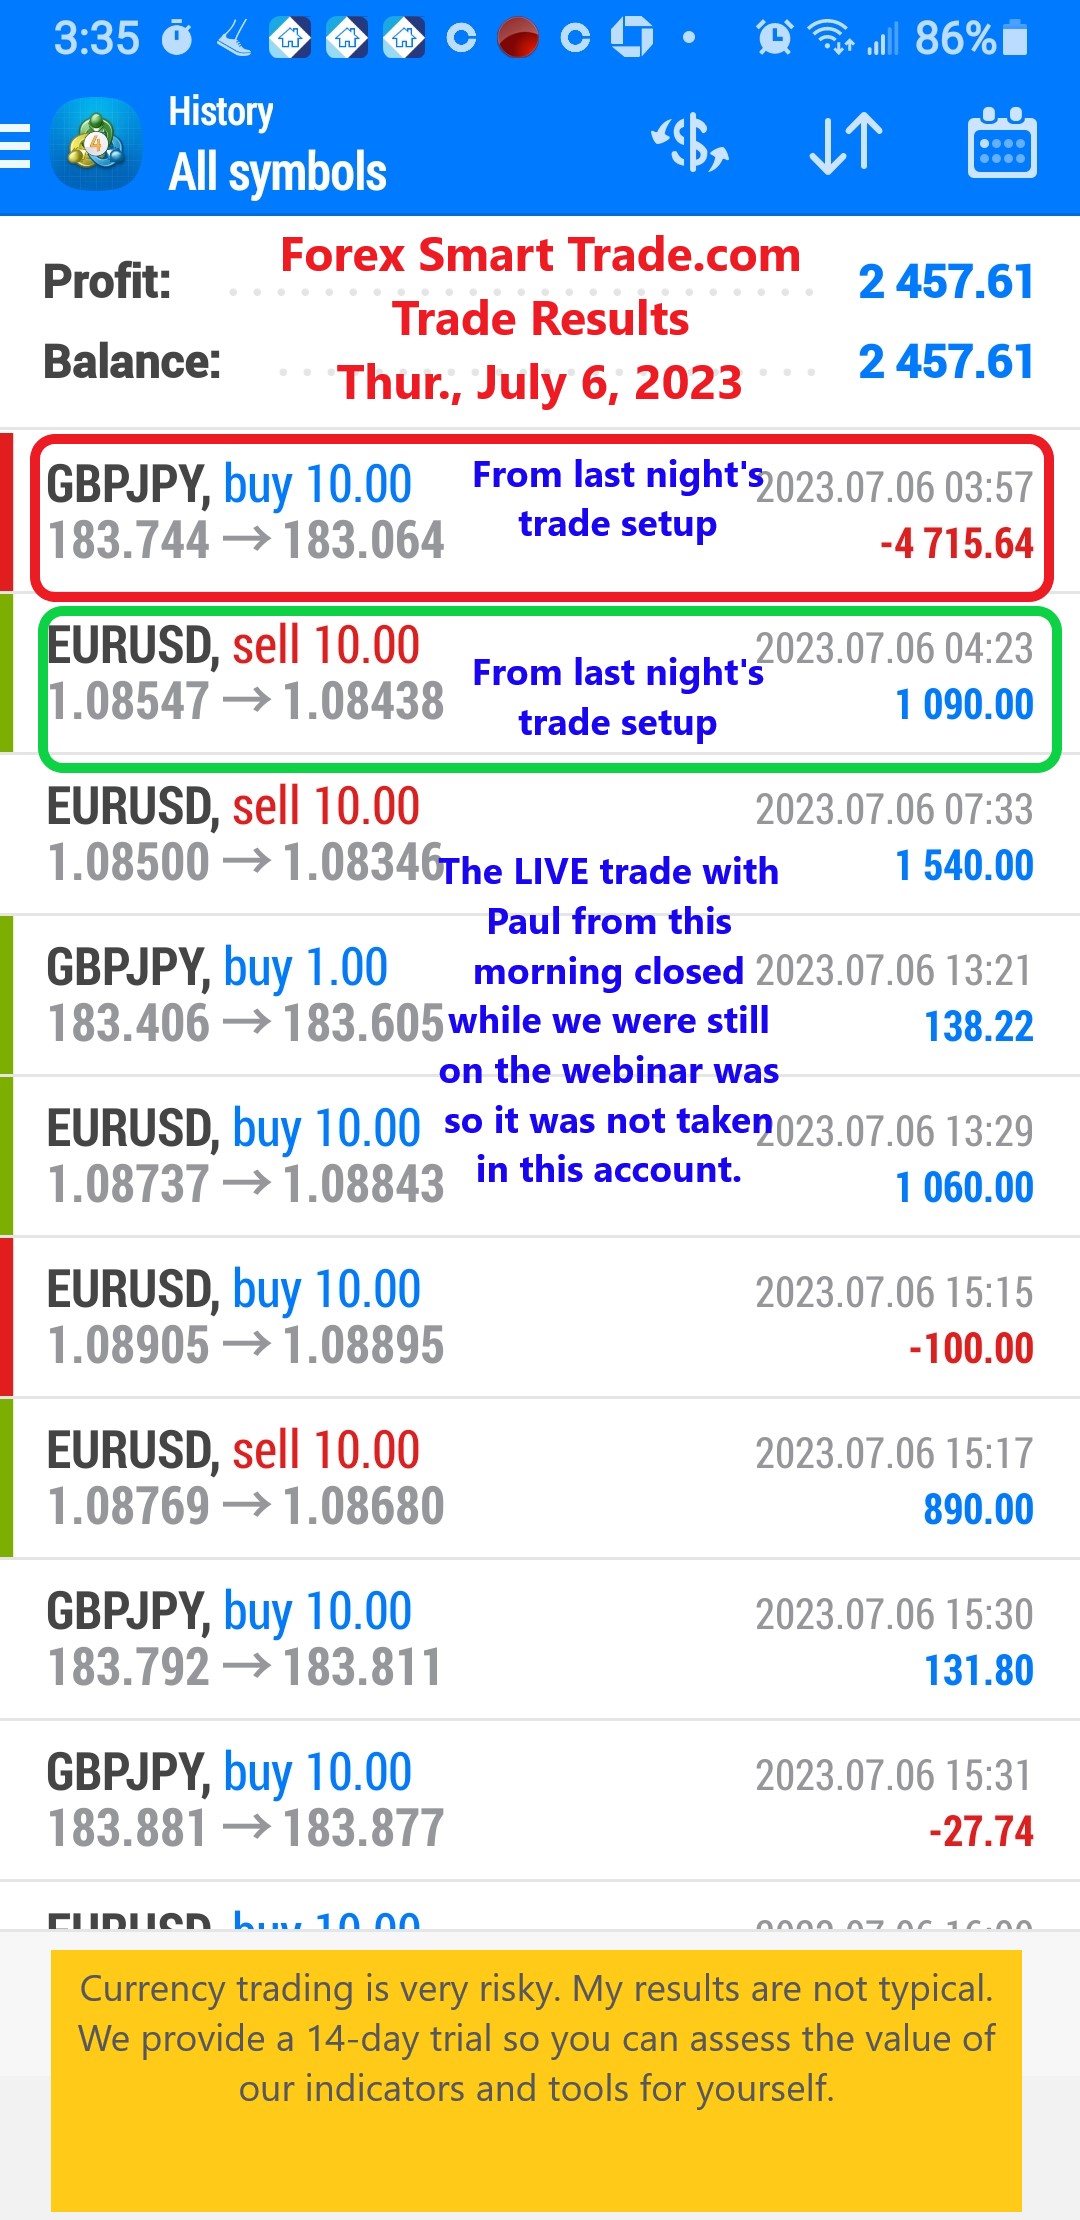
Forex Smart Trade Results, Thursday, July 6, 2023 – $2,457
Reviewing Various Technical Indicators. Let’s continue our discussion from the previous session reviewing various technical indicators. Aside from the actual profit and loss of each strategy, […]

Forex Smart Trade Results, Wednesday, July 5, 2023 – $1,347
What is the Best Technical Indicator in Forex? Let’s take a look at what is the best technical indicator in forex not counting the Forex Smart […]
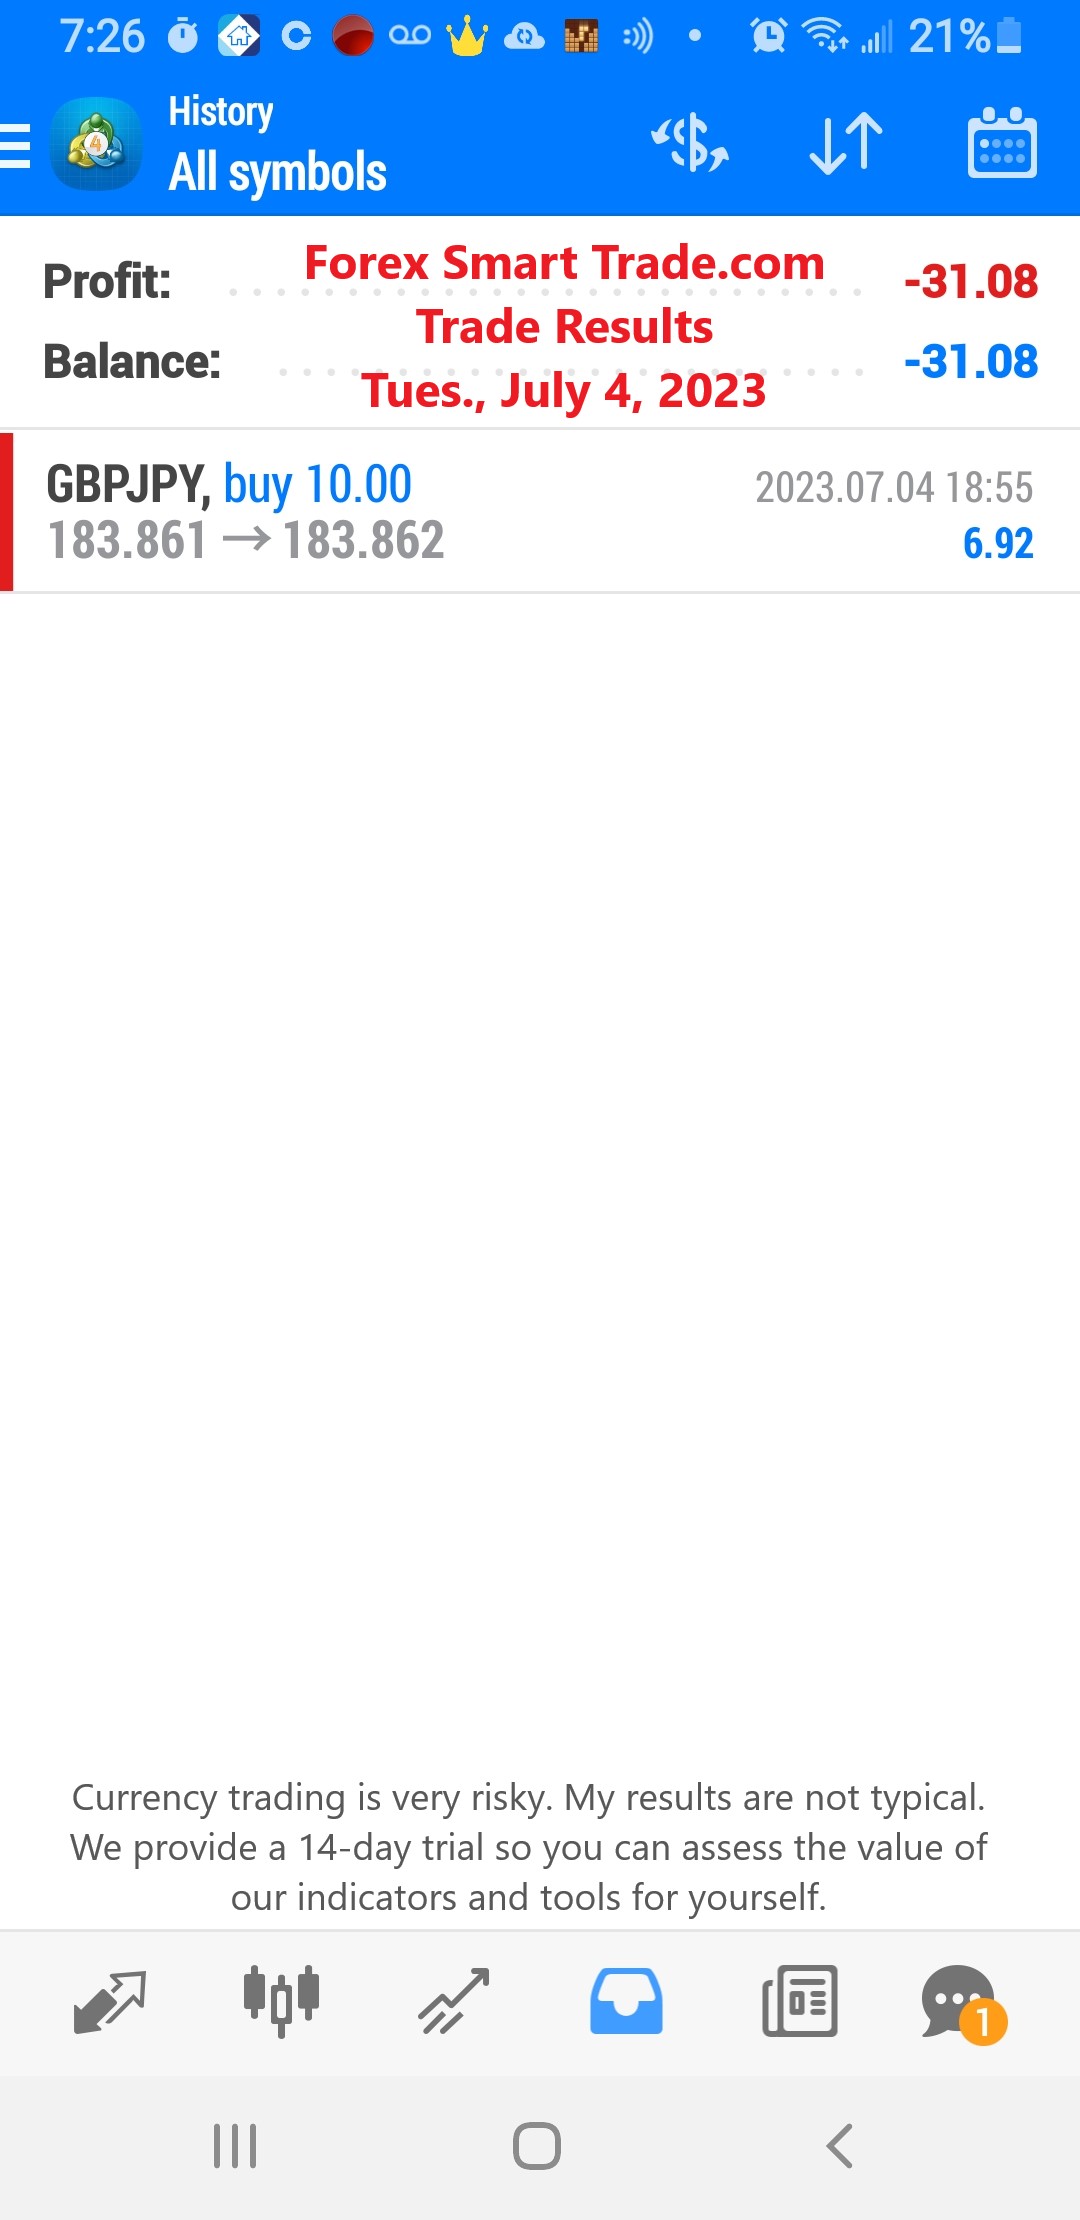
Forex Smart Trade Results, Tuesday, July 4, 2023 – ($31)
RSI + MACD. Here’s another example, with the RSI and the MACD this time. When the RSI reached the overbought area and gave a sell signal, the MACD soon followed […]
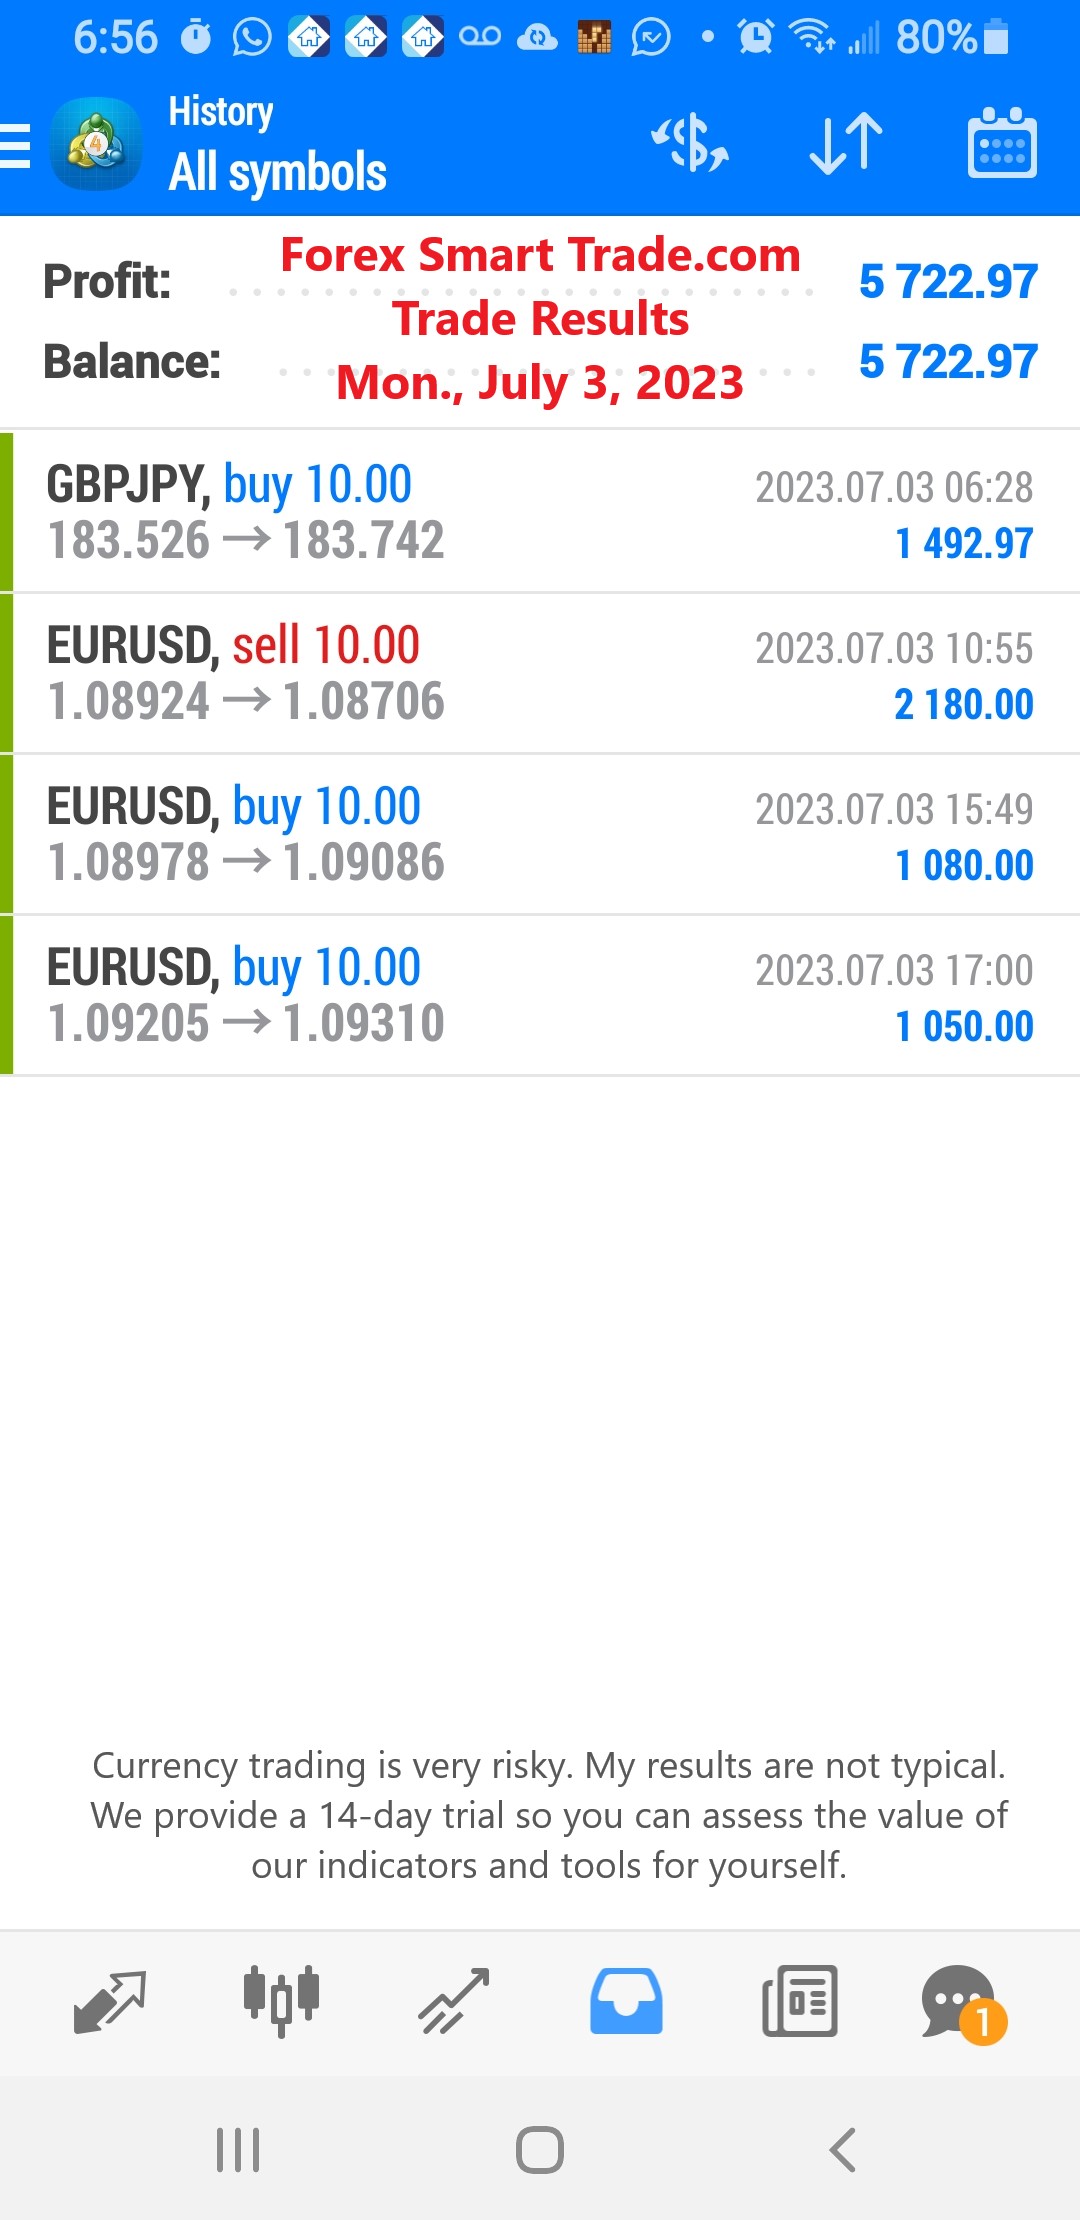
Forex Smart Trade Results, Monday, July 3, 2023 – $5,722
Trading with Multiple Chart Indicators. Let’s take a look at trading with multiple chart indicators. Now that you know how some of the most common chart […]
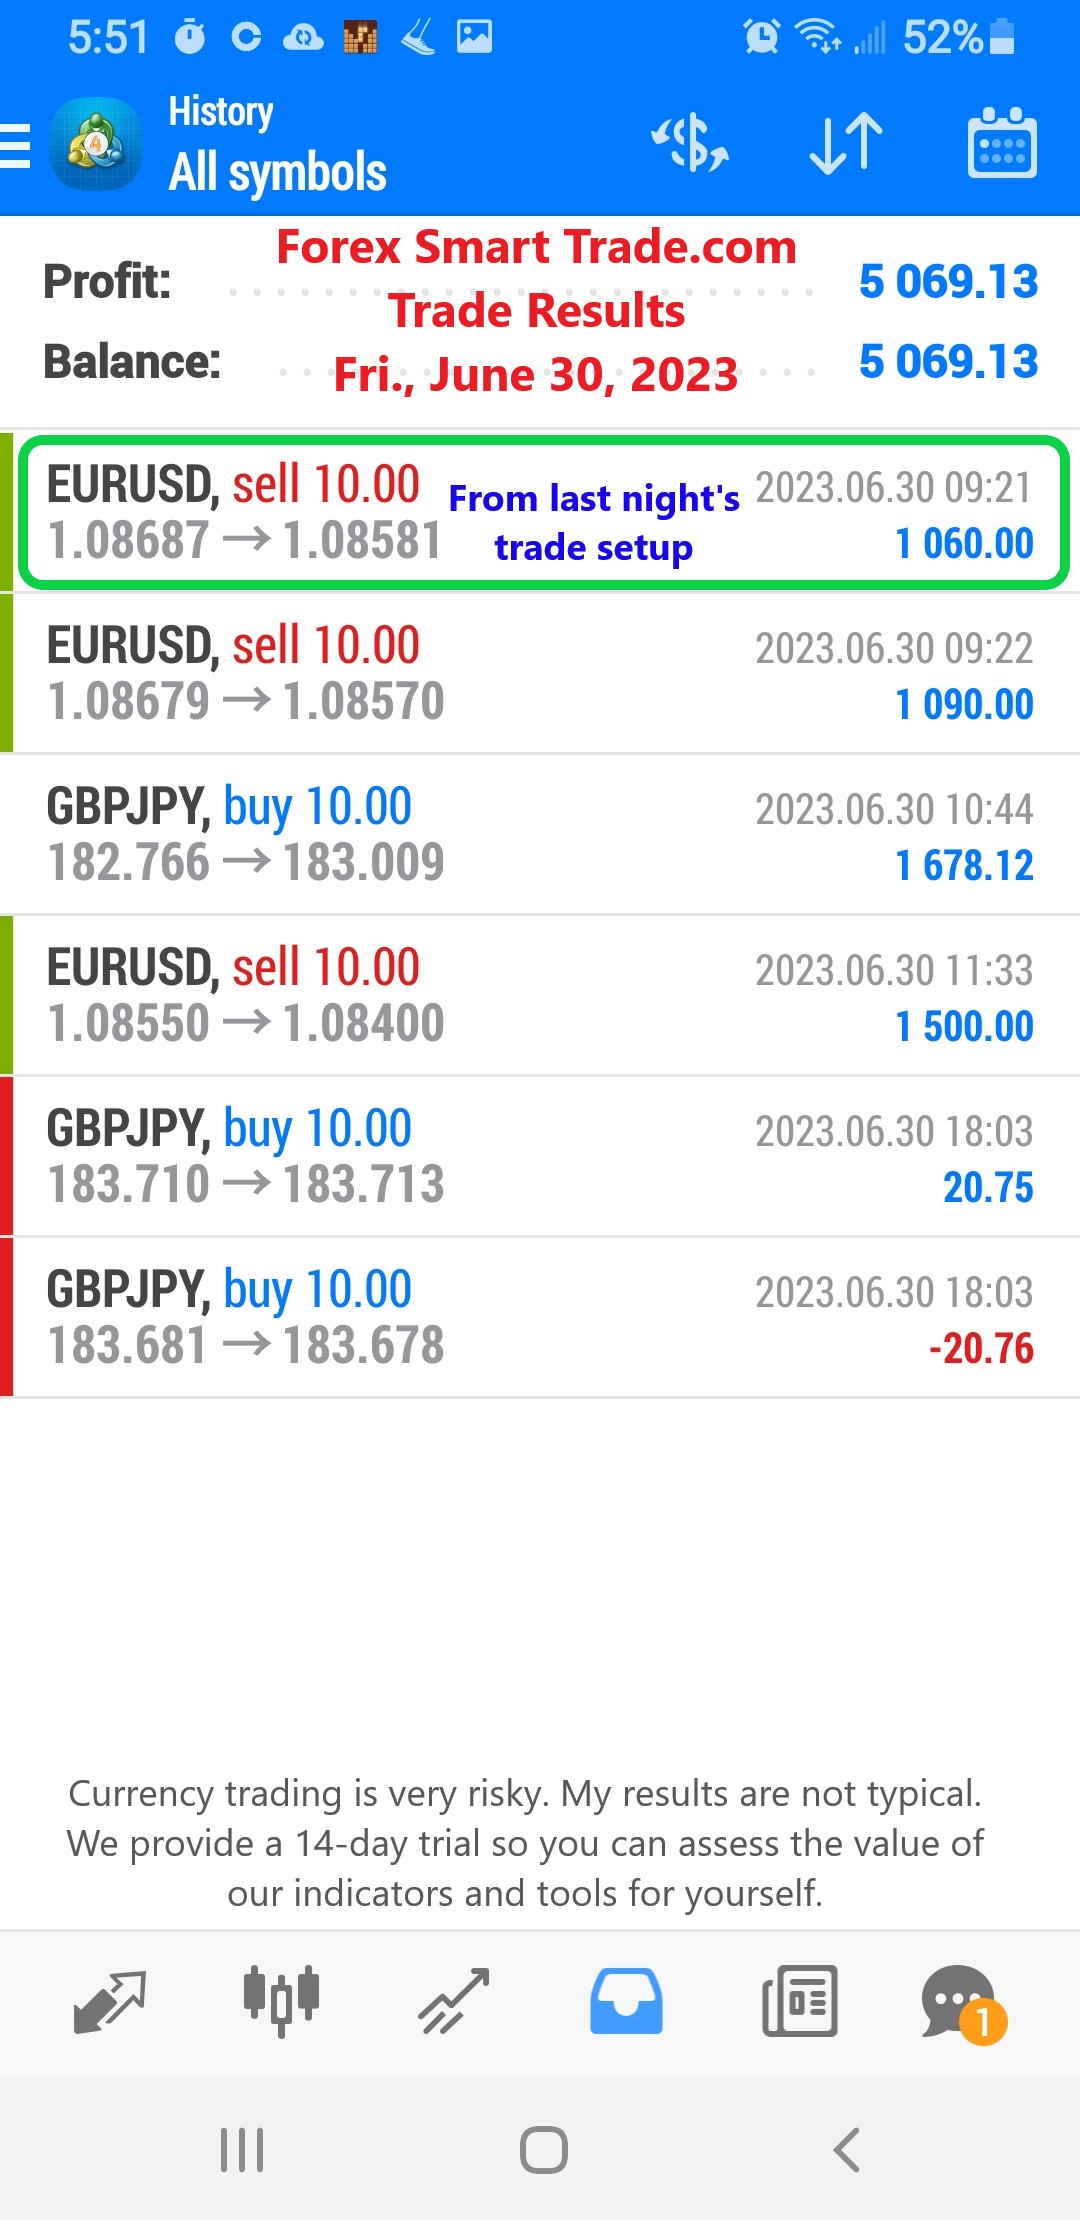
Forex Smart Trade Results, Friday, June 30, 2023 – $5,069
How to Trade Using Ichimoku Kinko Hyo. Senkou Let’s take a look at the Senkou span first. If the price is above the Senkou span, the […]
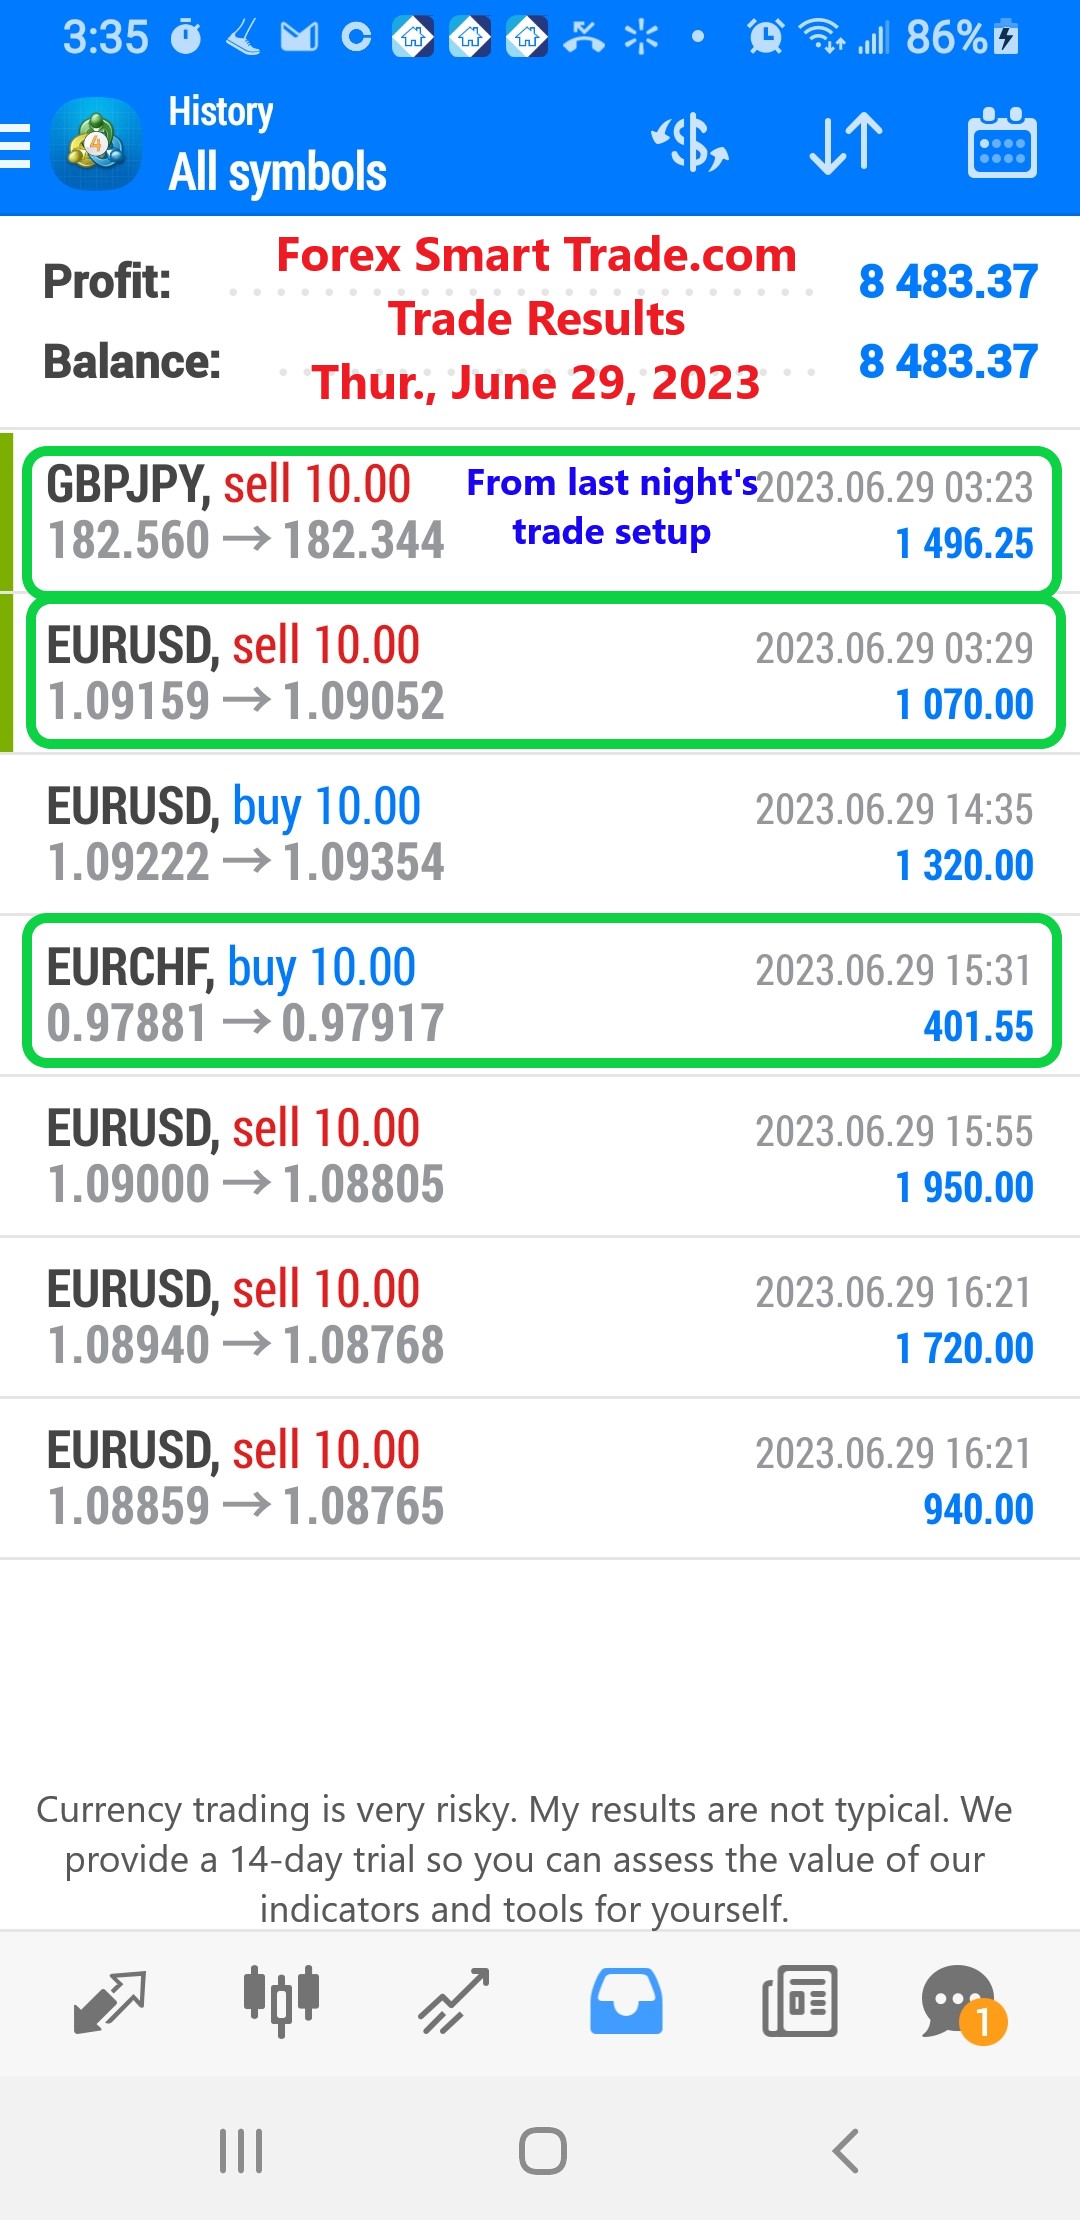
Forex Smart Trade Results, Thursday, June 29, 2023 – $8,483
More About Ichimoku Kinko Hyo. Now let’s try to find out more about Ichimoku Kinko Hyo and what each of the lines is for. Kijun Sen […]
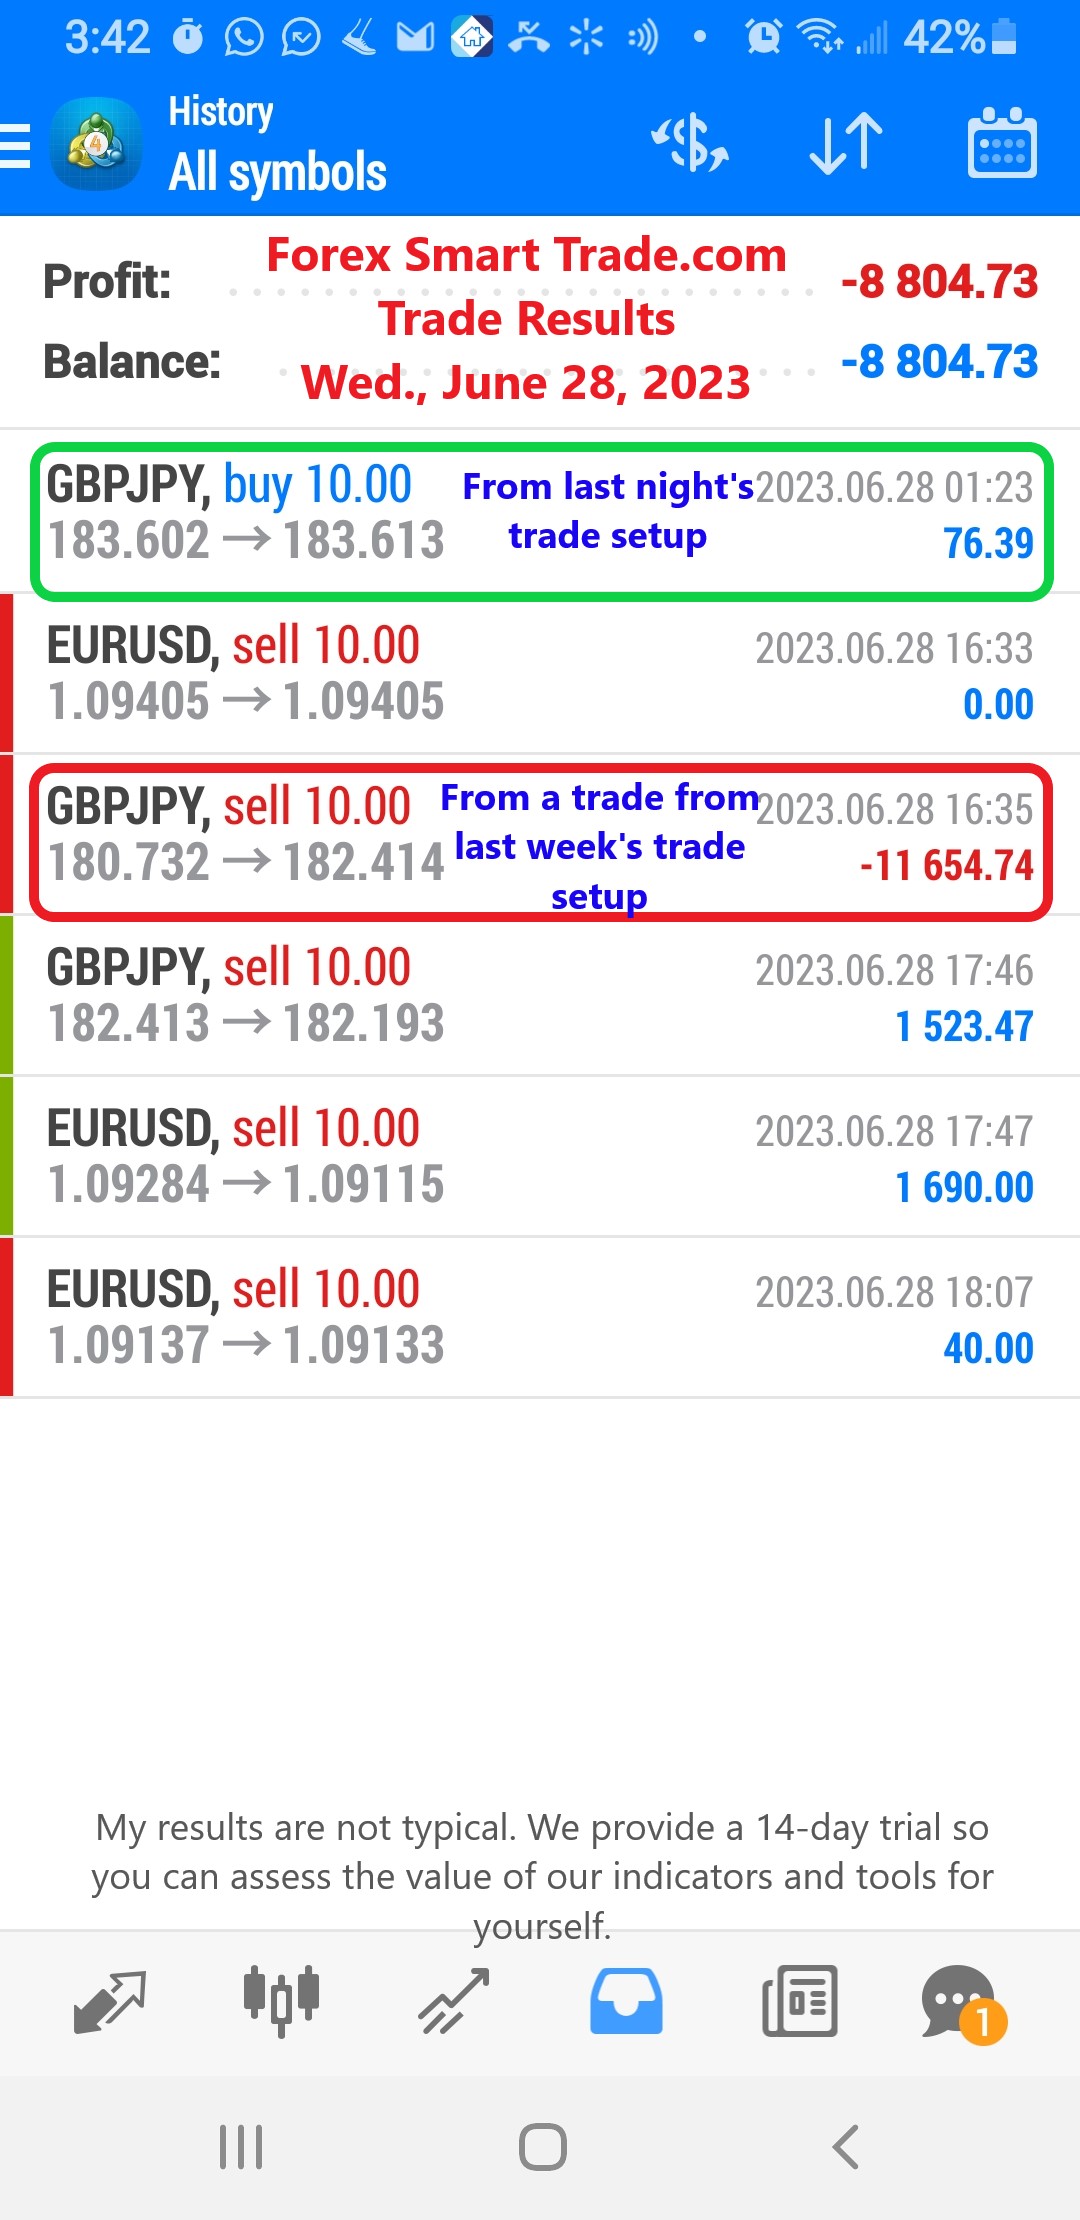
Forex Smart Trade Results, Wednesday, June 28, 2023 – ($8,804)
Ichimoku Kinko Hyo. Let’s examine a technique known as Ichimoku Kinko Hyo (IKH). No, “Ichimoku Kinko Hyo” ain’t Japanese for “May the pips be with you.” […]
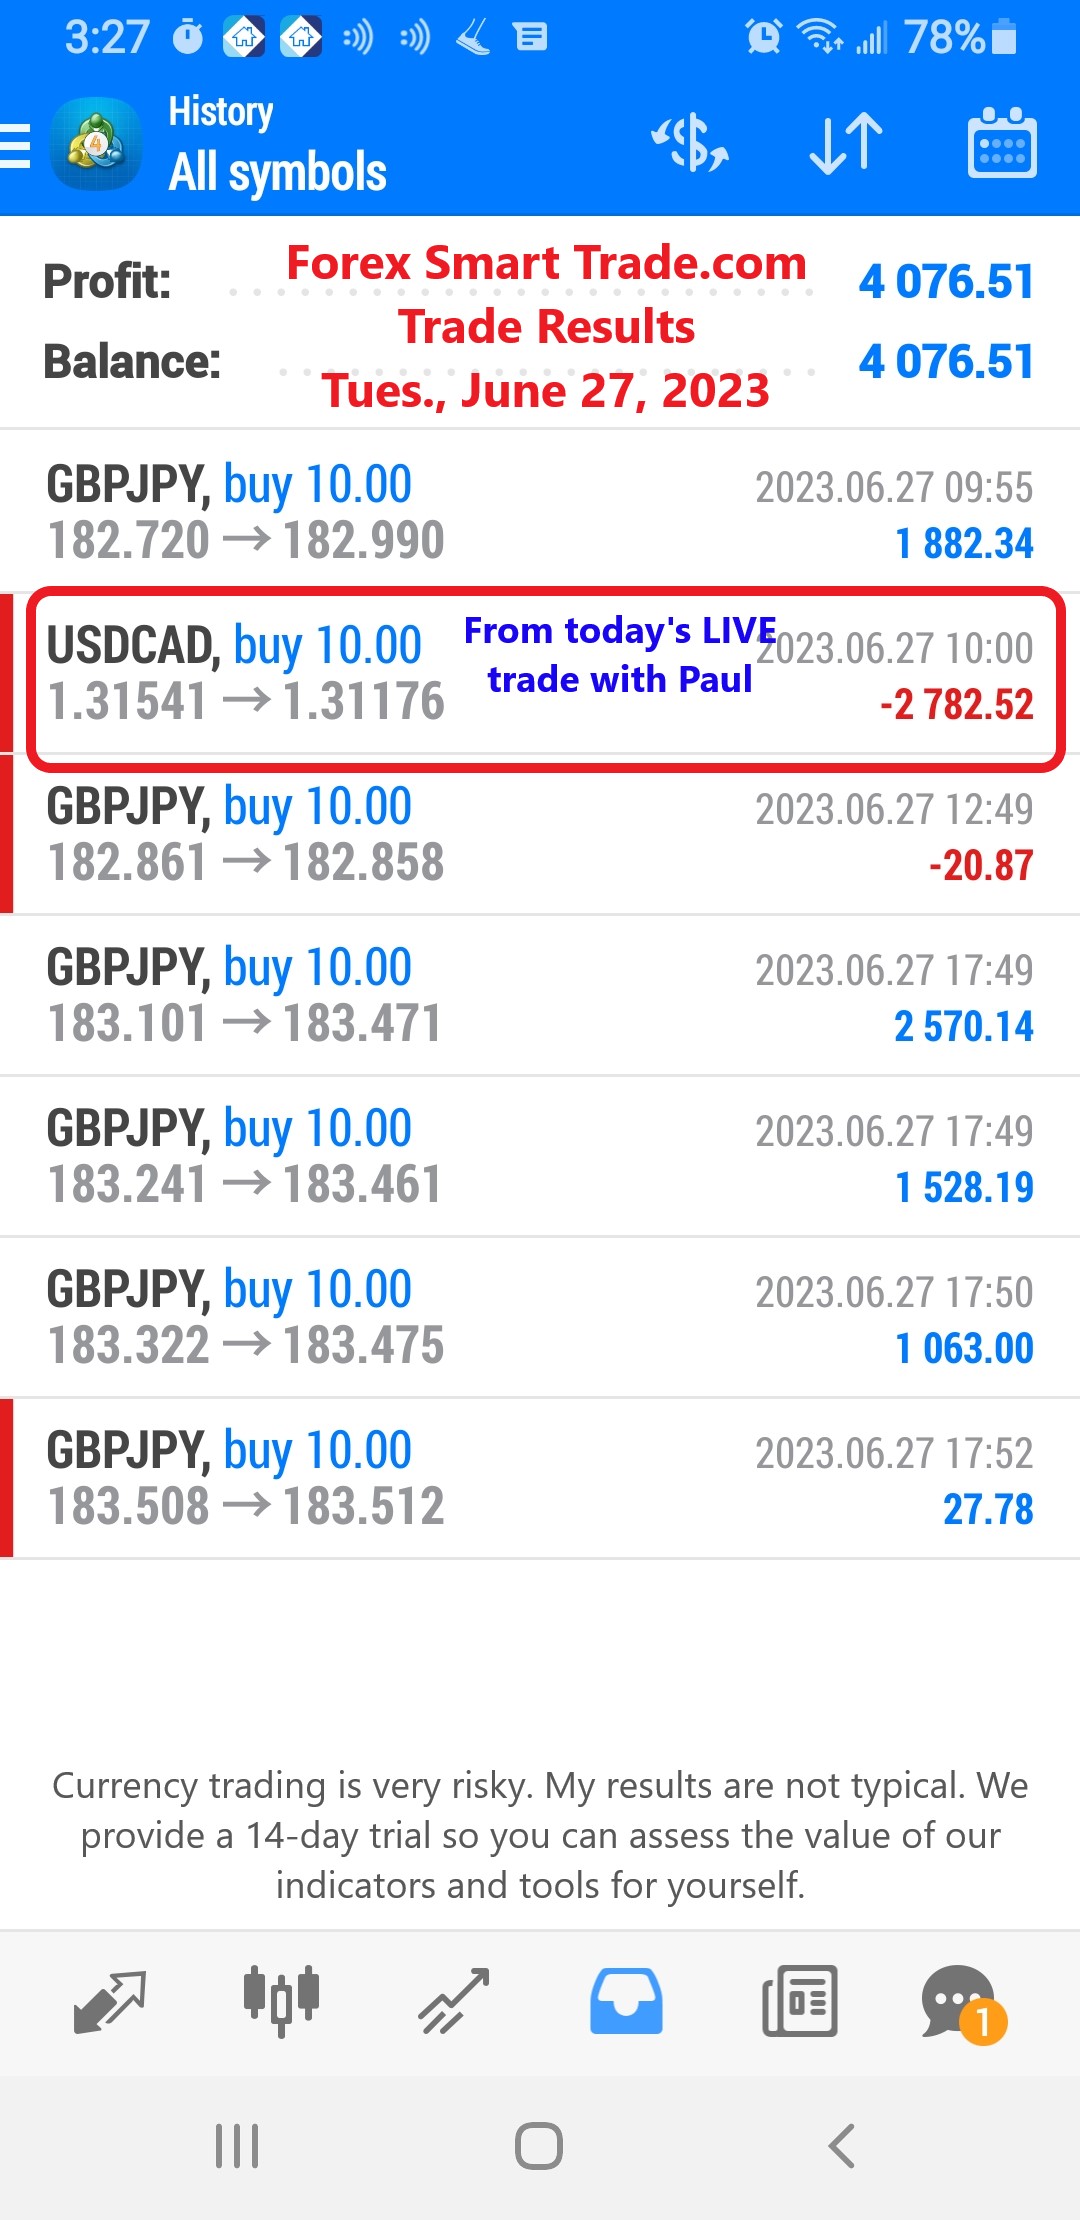
Forex Smart Trade Results, Tuesday, June 27, 2023 – $4,076
How to Trade Using ADX. One way to trade using ADX is to wait for breakouts first before deciding to go long or short. They can use ADX […]
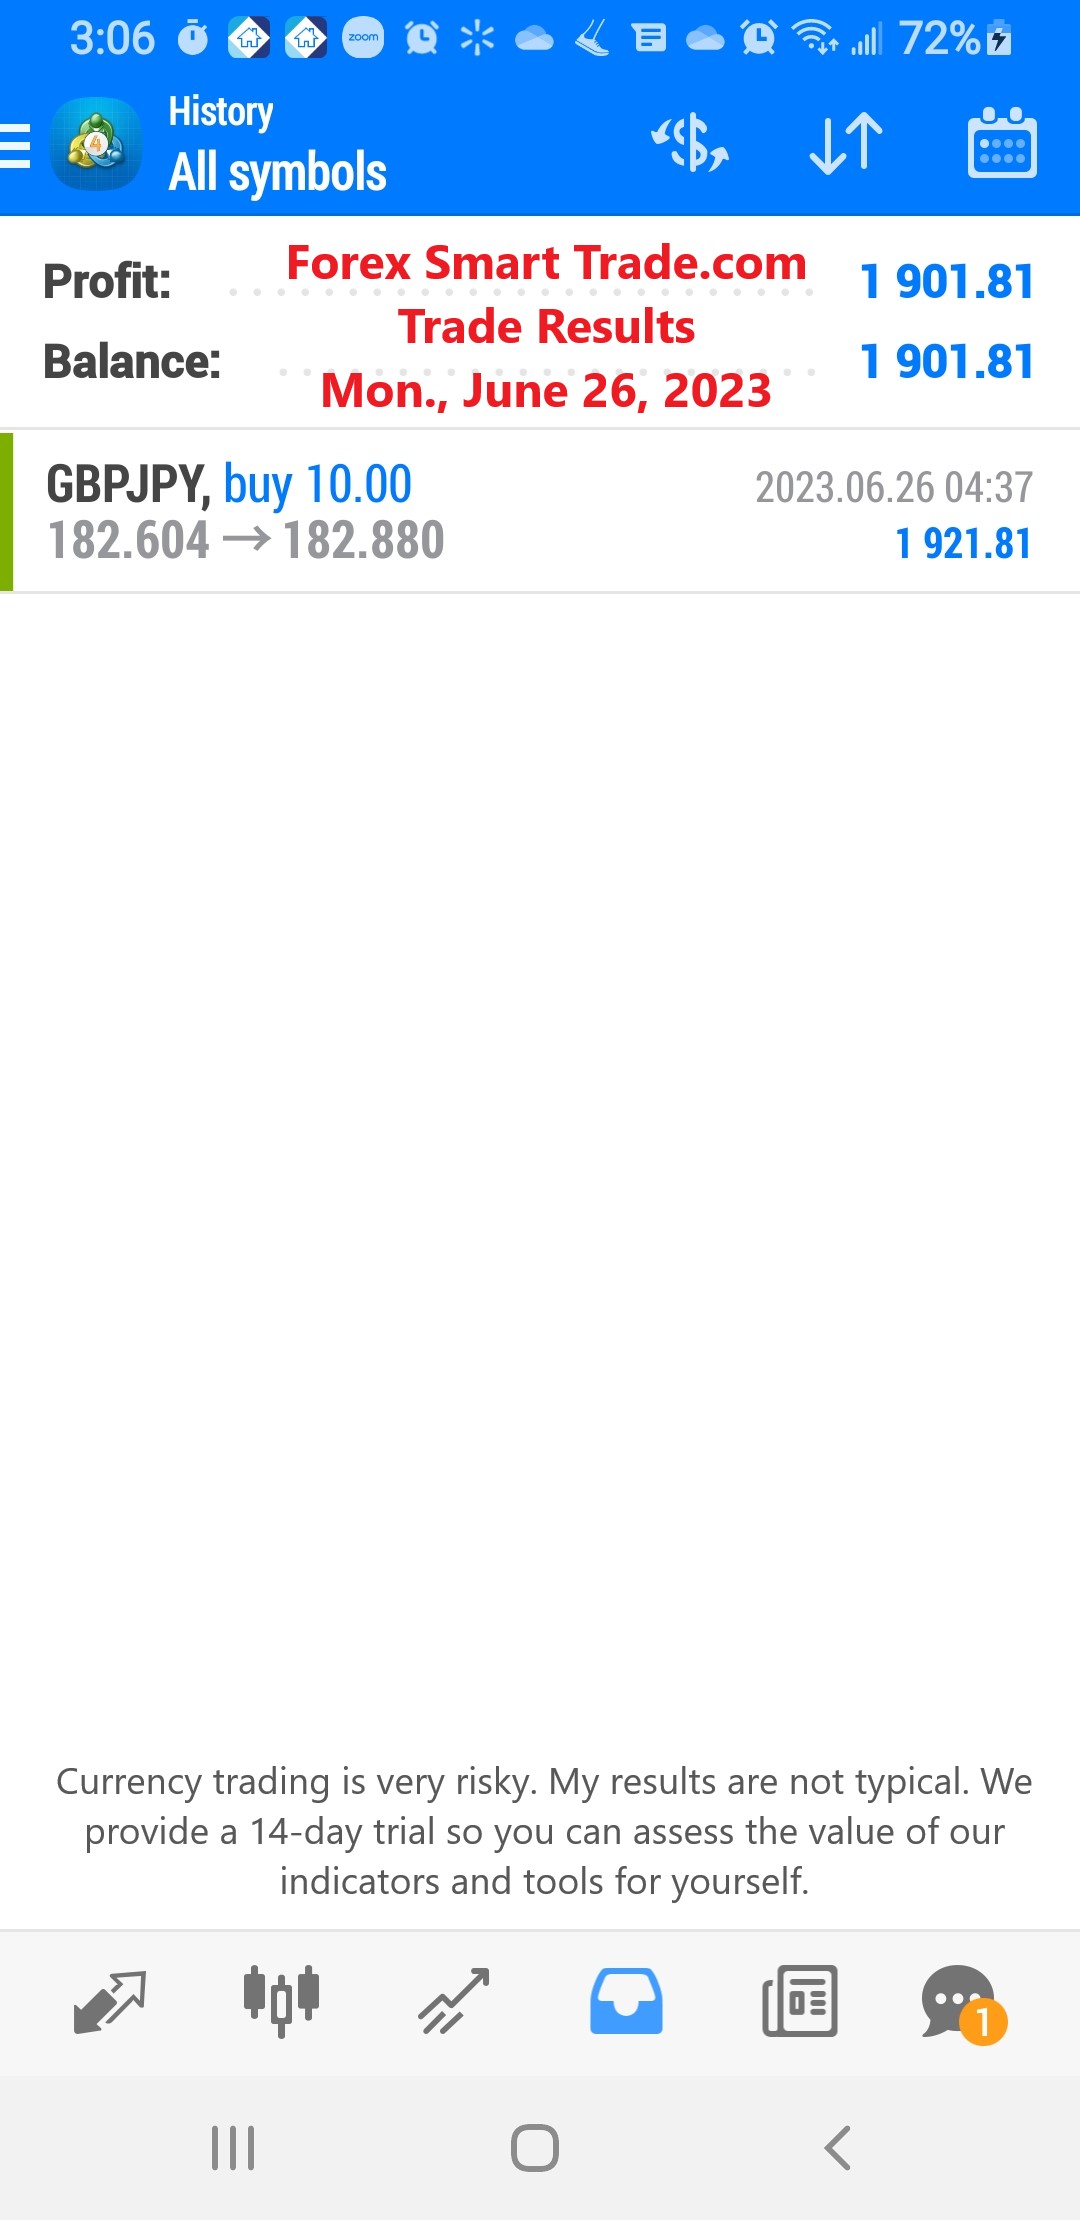
Forex Smart Trade Results, Monday, June 26, 2023 – $1,901
How to Use ADX. When you’re using the ADX indicator, keep an eye on the 20 and 40 as key levels. here’s a little cheat sheet […]
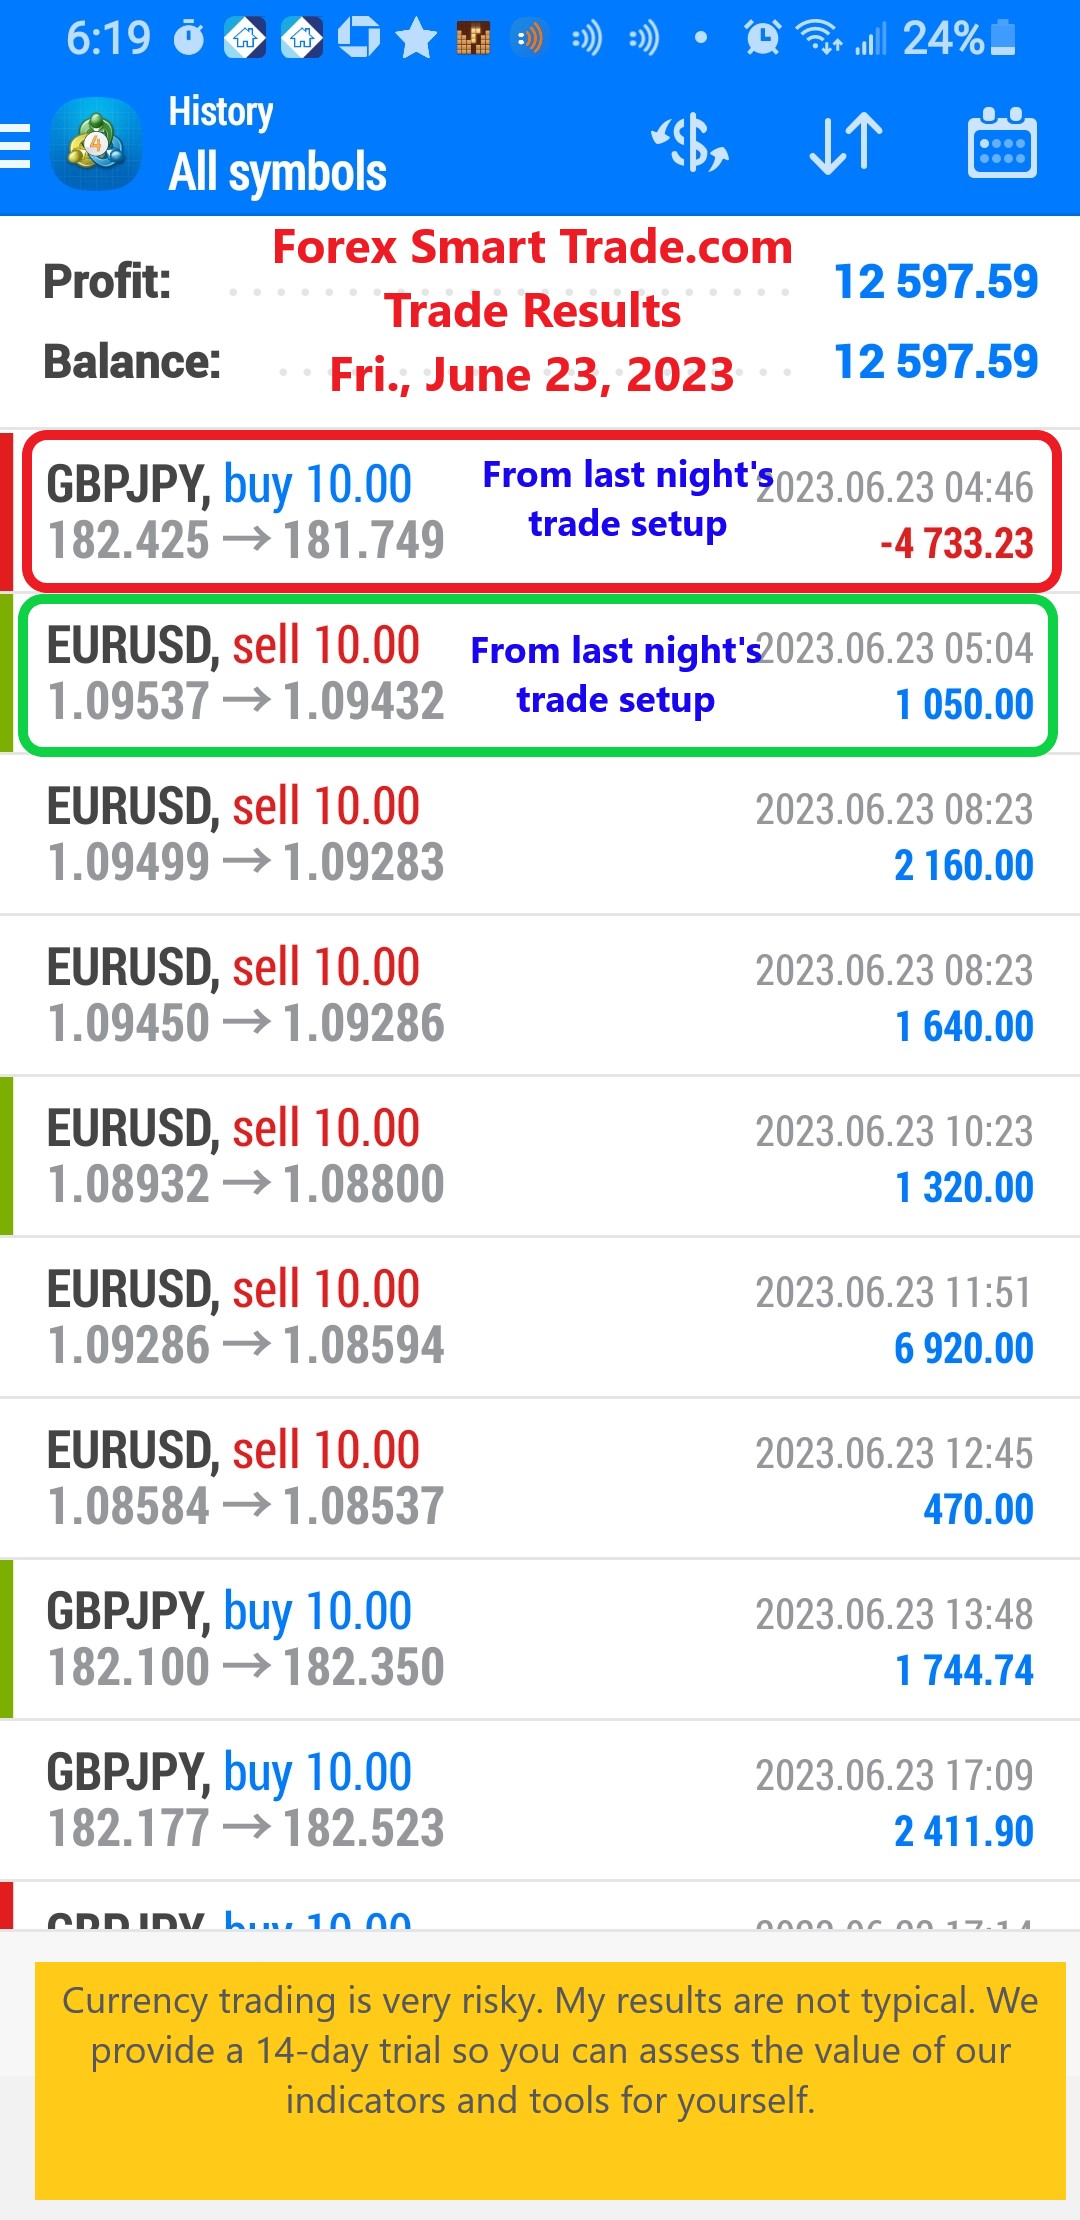
Forex Smart Trade Results, Friday, June 23, 2023 – $12,597
How to Use ADX (Average Directional Index). Let’s take a look at how to use the ADX (average directional index). When trading, it’s helpful to gauge […]
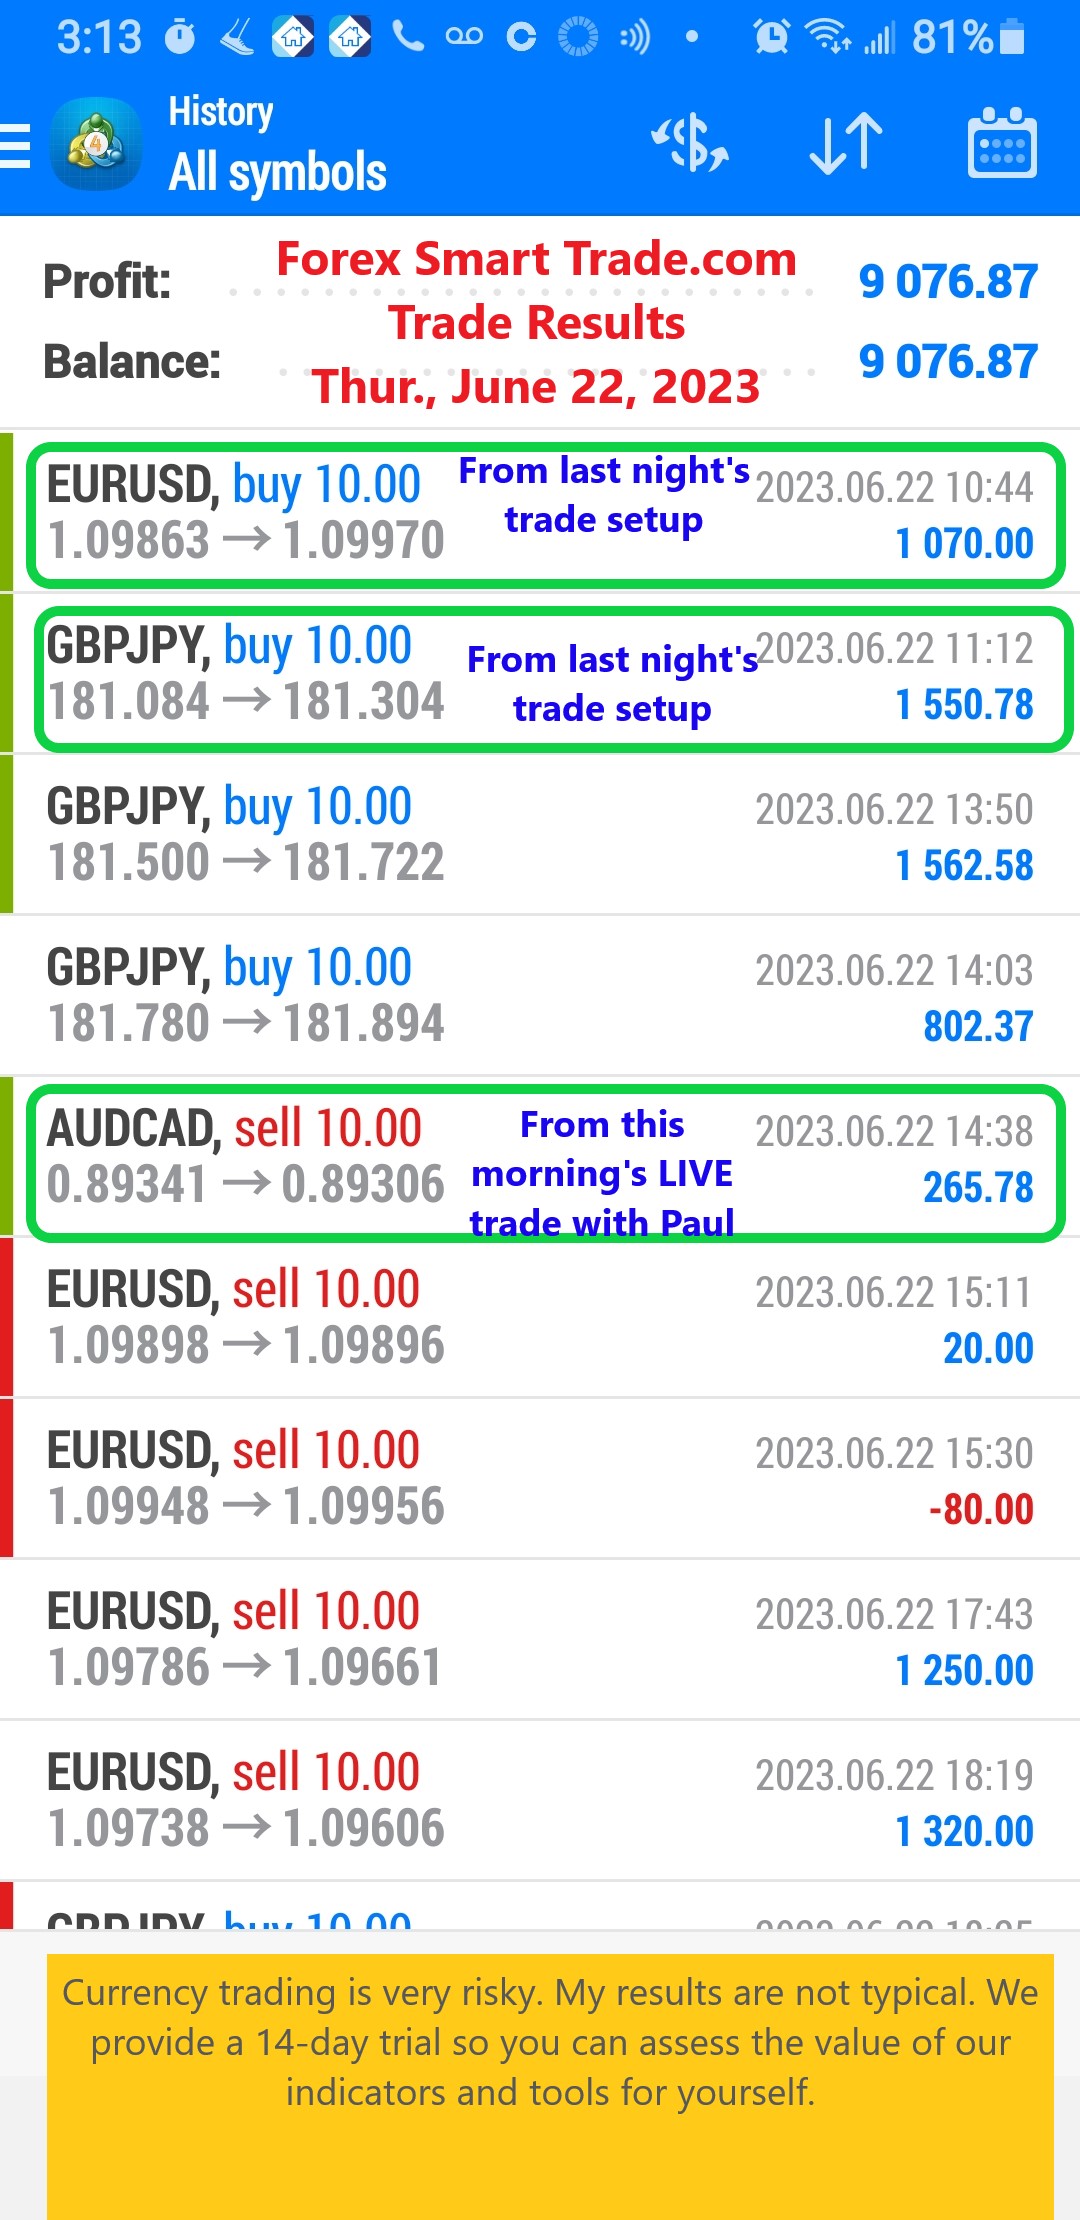
Forex Smart Trade Results, Thursday, June 22, 2023 – $9,076
Determining Trend Strength Using %R. Let’s look at determining trend strength using %R. Williams %R’s sensitivity to volatile prices comes in handy when you want to […]
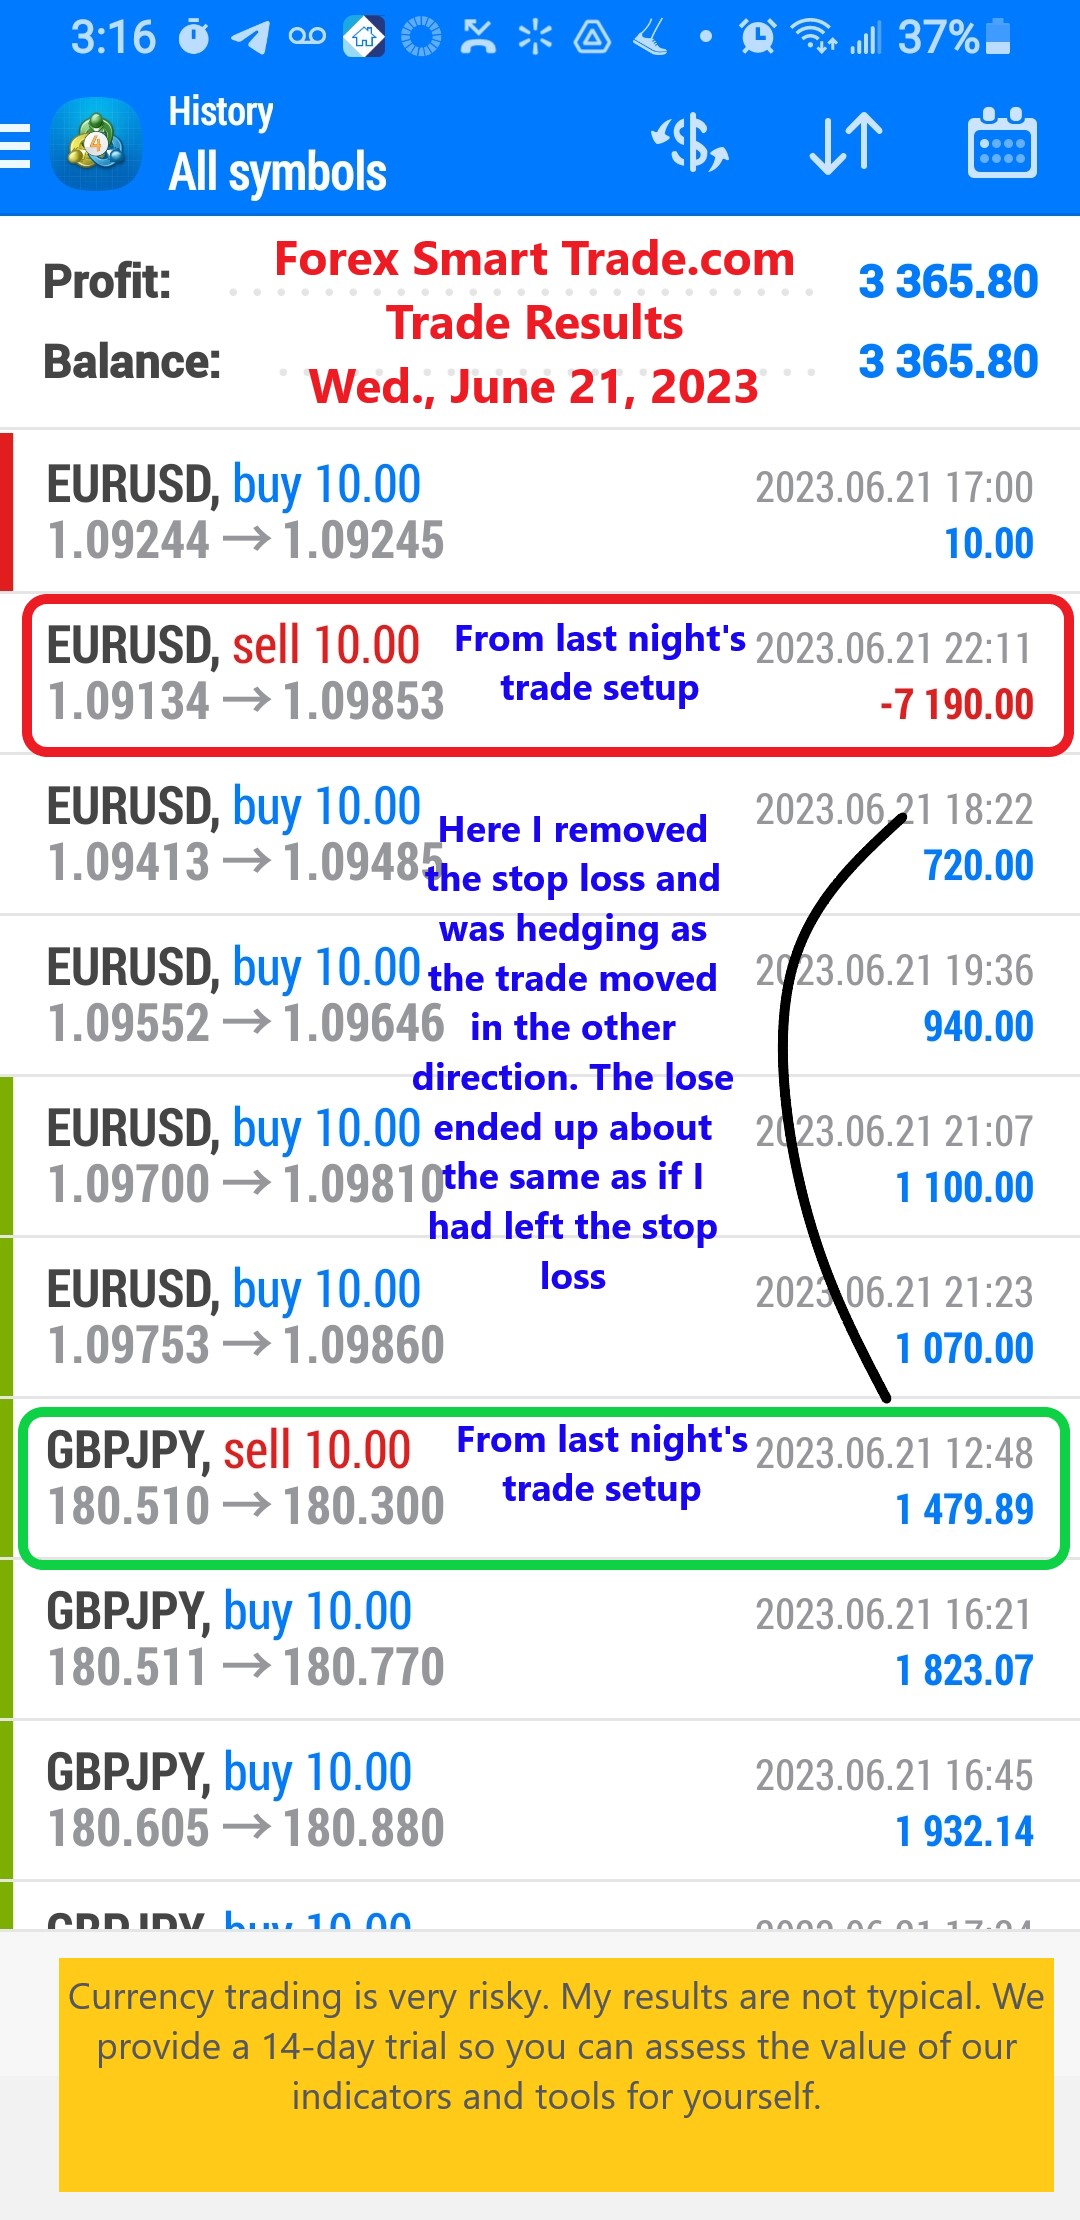
Forex Smart Trade Results, Wednesday, June 21, 2023 – $3,365
How to Use Williams %R (Williams Percent Range). The Williams Percent Range, also called Williams %R, is a momentum indicator that shows you where the last closing price is relative […]